Welcome to Genetic Affairs
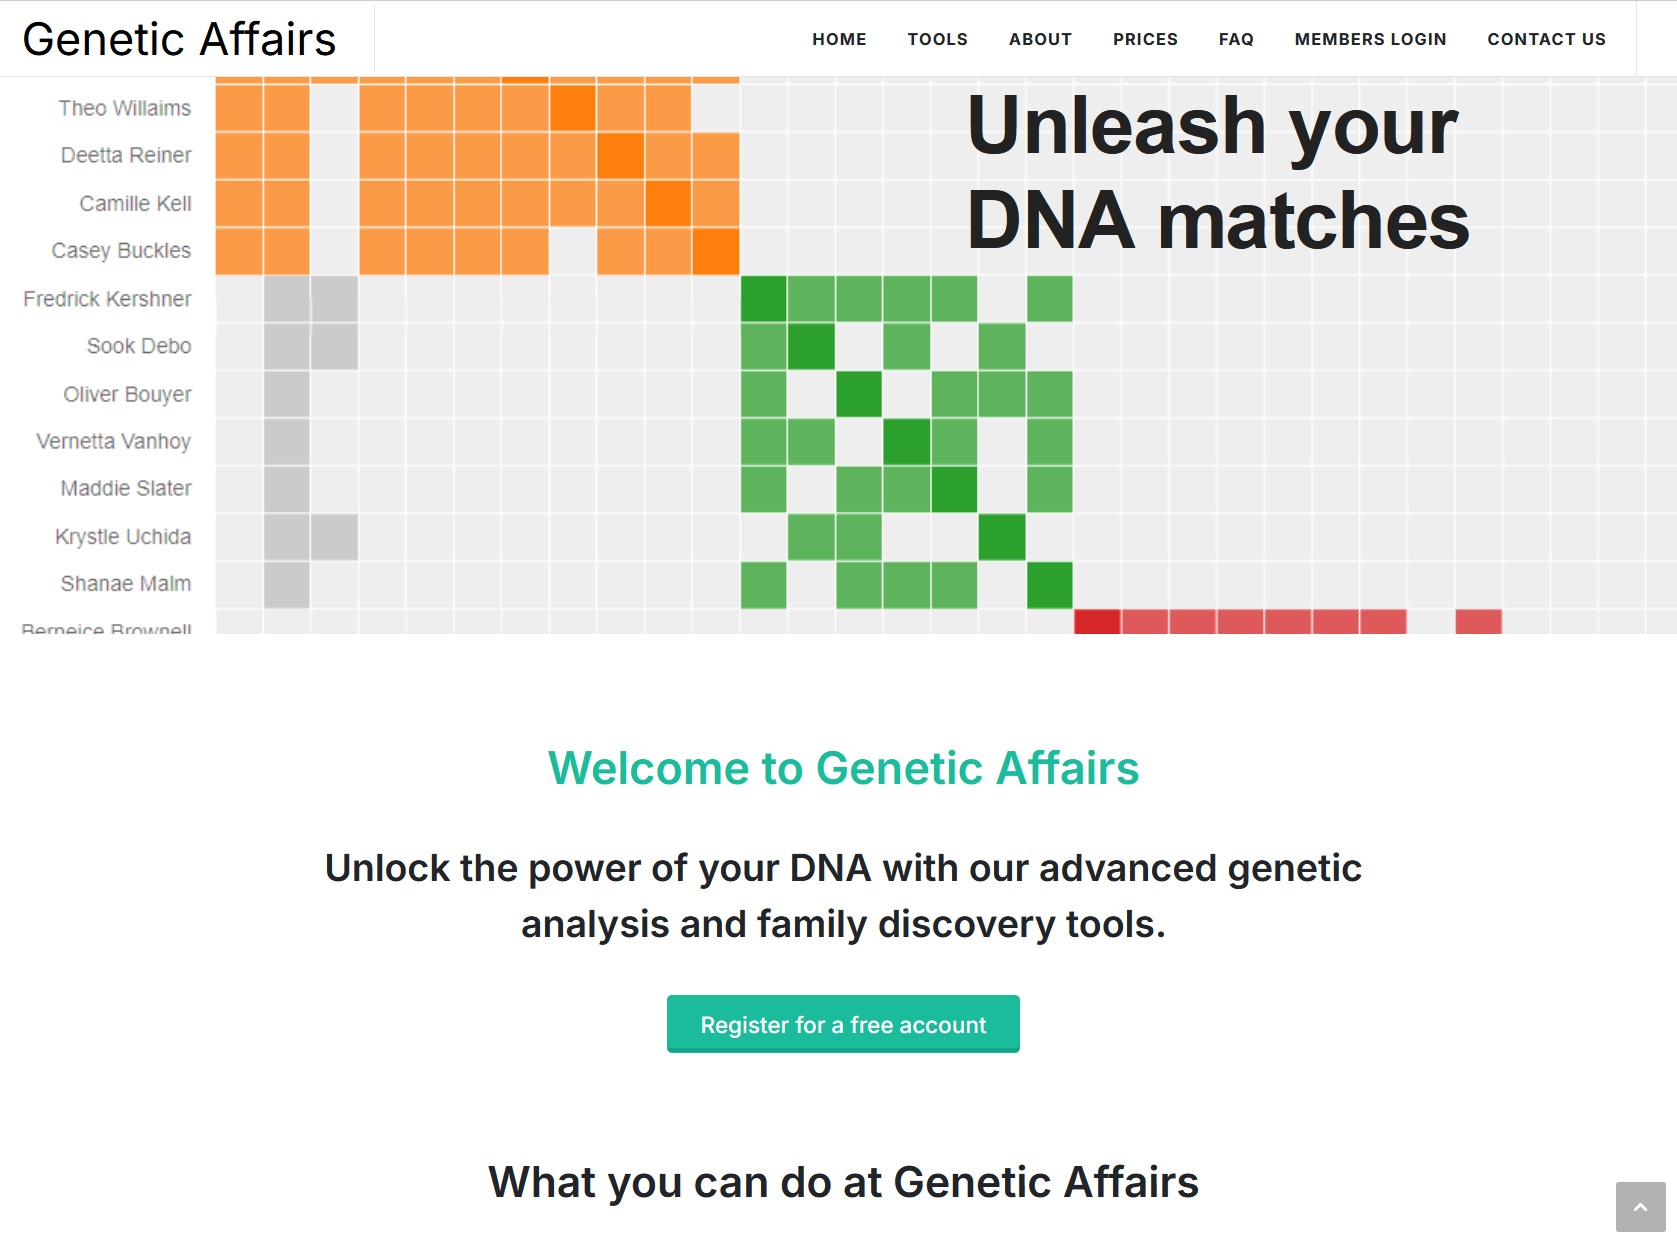
Genetic Affairs is a genetic genealogy platform created by Dr Evert-Jan Blom, a Dutch molecular geneticist and bioinformatician. It automates the heavy lifting of DNA-match analysis: downloading your matches, clustering them, pulling trees together to spot common ancestors, and reconstructing partial family trees from the evidence.
The platform runs at two addresses:
- www.geneticaffairs.com: public information and pricing.
- members.geneticaffairs.com: where you register kits and run all the tools.
What changed recently
- FamilyTreeDNA is now the only company that accepts website registration on Genetic Affairs for automated analyses. Ancestry was discontinued in June 2020; 23andMe support ended after 23andMe changed its security protocols.
- Most offline AutoSegment files can no longer be downloaded from the testing companies. The offline workflow remains useful only if you already saved those files on your computer previously.
- AutoLineage is now the flagship tool: it's where clustering, trees, common-ancestor detection and tree reconstruction come together.
Supported testing companies
| Company | Automated analysis | AutoLineage import options |
|---|---|---|
| FamilyTreeDNA | ✅ The only fully automated company |
nodes.csv + edges.csv from an automated
run; CSV files from DNA Gedcom
|
| MyHeritage | AutoCluster embedded at MyHeritage | Locally saved HTML files; AutoCluster HTML file; CSV files from DNA Gedcom |
| Ancestry | ❌ (automated retrieval ended 2020) | Copy-Paste Wizard; locally saved HTML files; CSV files from DNA Gedcom |
| GEDmatch | AutoCluster & AutoKinship as Tier 1 |
nodes.csv + edges.csv from an automated
run; one-to-many HTML/CSV files
|
| 23andMe | ❌ | Locally saved HTML files; AutoCluster HTML file; CSV files from DNA Gedcom |
| All vendors | AutoLineage backup files (matches and shared matches) |
The tools, in brief
AutoCluster groups your matches by shared-match relationships. AutoTree finds common ancestors in your matches' trees. AutoSegment clusters by overlapping DNA segments. AutoKinship predicts trees from DNA alone. AutoLineage is the cross-company workbench that blends all of the above.
Getting started
Create an account
- Visit members.geneticaffairs.com/register.
- Enter name, email and password.
- Confirm your email. You land on the members page.
New accounts receive 200 free credits: enough to try an automated AutoCluster or AutoKinship run on a moderate-sized match list.
Credits and subscriptions
Each analysis costs a small number of credits. You can buy credits in single top-ups or subscribe monthly. Monthly subscribers receive a 10% bonus on every purchase and unlock advanced AutoLineage features. Payments use Stripe.
View pricing plans
| Plan | Cost | Features |
|---|---|---|
| Free Trial | $0 / month |
|
| Subscriber (most popular) | $5–50 / month |
|
Adding an FTDNA profile
The members site now includes a streamlined interface designed specifically for adding FTDNA profiles. You no longer need to provide your FTDNA password when adding a profile, your password (and 2FA code if enabled) is only entered when starting an analysis, making the process safer and more privacy-friendly.
- On the members landing page, click Register a new website.
- The wizard opens with the title Register FamilyTreeDNA Profile.
- Enter your FamilyTreeDNA kit number and the name of the tested person.
- Confirm with Register profile.
- A notice will appear about FTDNA's password policy update. Read it and click I understand, continue.
- Once verified, you arrive at the Websites / Profiles page.
Running an FTDNA analysis: the wizard
From the Websites / Profiles overview, click Start analysis next to the profile you want to run. A wizard guides you through every step:
- Select analysis: choose AutoCluster, AutoSegment ICW, AutoTree, or AutoKinship.
- Adjust cM range: set the upper and lower shared-cM thresholds.
- Match selection: run on all matches, or start with specific matches of interest.
- Password & 2FA: enter your FTDNA password and, if enabled, your 2FA code.
- Cost summary: review the credit cost before confirming and click Perform analysis. Results arrive by email as a ZIP file.
Two-factor authentication (2FA)
Genetic Affairs now fully supports FTDNA's two-factor authentication. When 2FA is enabled on your FTDNA account, simply enter your 2FA code in the wizard's password step.
Always unzip first
Your analysis results arrive by email as a ZIP file and appear in the notifications bell on the members site. Unzip before opening. The HTML file inside the ZIP contains links to other files in the same folder; opening it inside the ZIP produces broken-link errors.
Clustering background
Every clustering tool in Genetic Affairs builds on the same idea: people who share DNA with you and also share DNA with each other probably descend from a common branch of your family tree. That simple observation has been the engine behind genetic-genealogy clustering since 2018, and it is still the engine behind the modern AutoLineage workflow. This chapter explains how clustering works, why the colourful diagonal charts look the way they do, and how the technique has evolved from a hand-coloured spreadsheet into today's weighted clusters annotated with named ancestors.
DNA matches and shared matches
A DNA match is another tester who shares one or more DNA segments with you. Most testing sites express match strength as total centiMorgans (cM) shared, roughly, how much DNA you have in common. A close cousin might share 500–1000 cM with you; a distant cousin might share 20–50 cM.
A shared match: sometimes called an In Common With (ICW) match, is a third person who matches both you and one of your matches. Shared-match information is what makes clustering possible. Instead of just knowing that matches A, B, and C all match you, you also know that A and B match each other but A and C do not. That extra information is enough to separate your matches into branches.
If two of your matches also share DNA with each other, they most likely descend from a common branch of your tree. If they do not share DNA with each other, they probably descend from different branches. A typical human has roughly four grandparent branches' worth of DNA, so your matches tend to fall into a handful of distinct groups, one per ancestral line that contributed meaningfully to your genome.
How a cluster forms
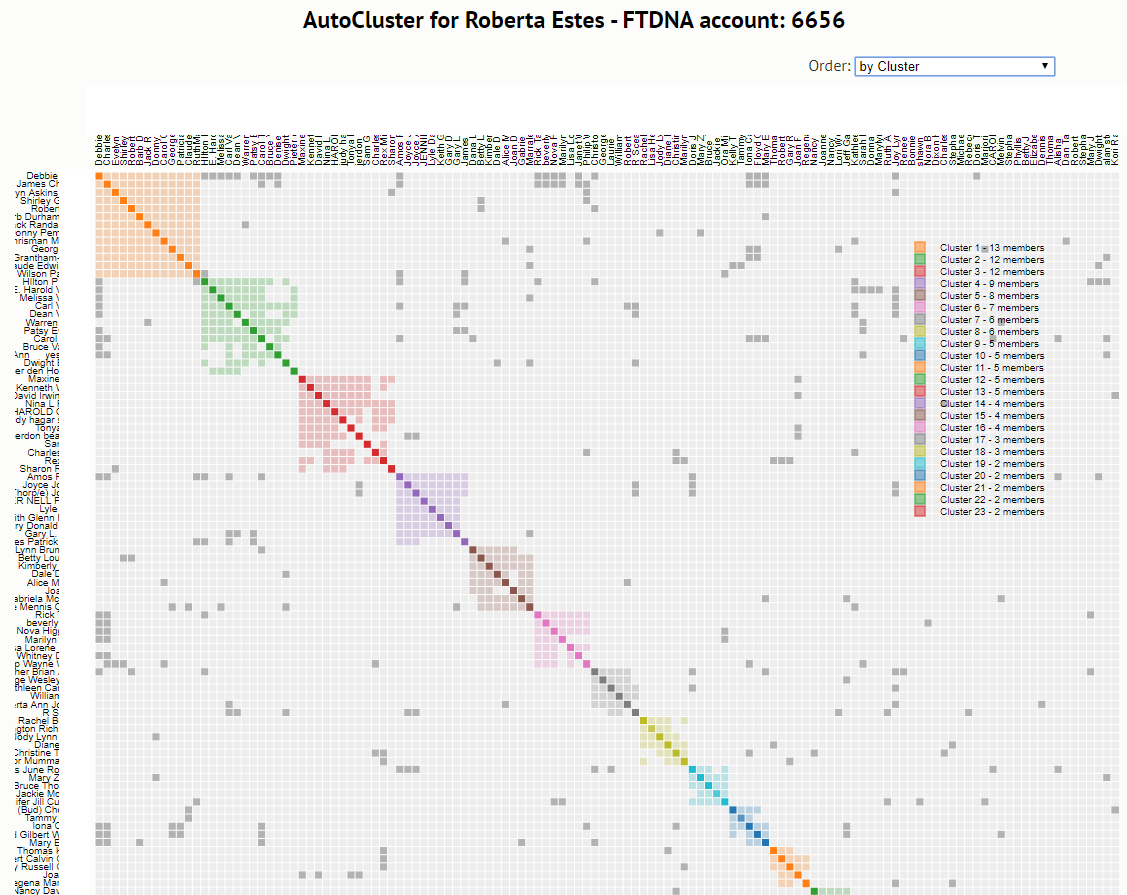
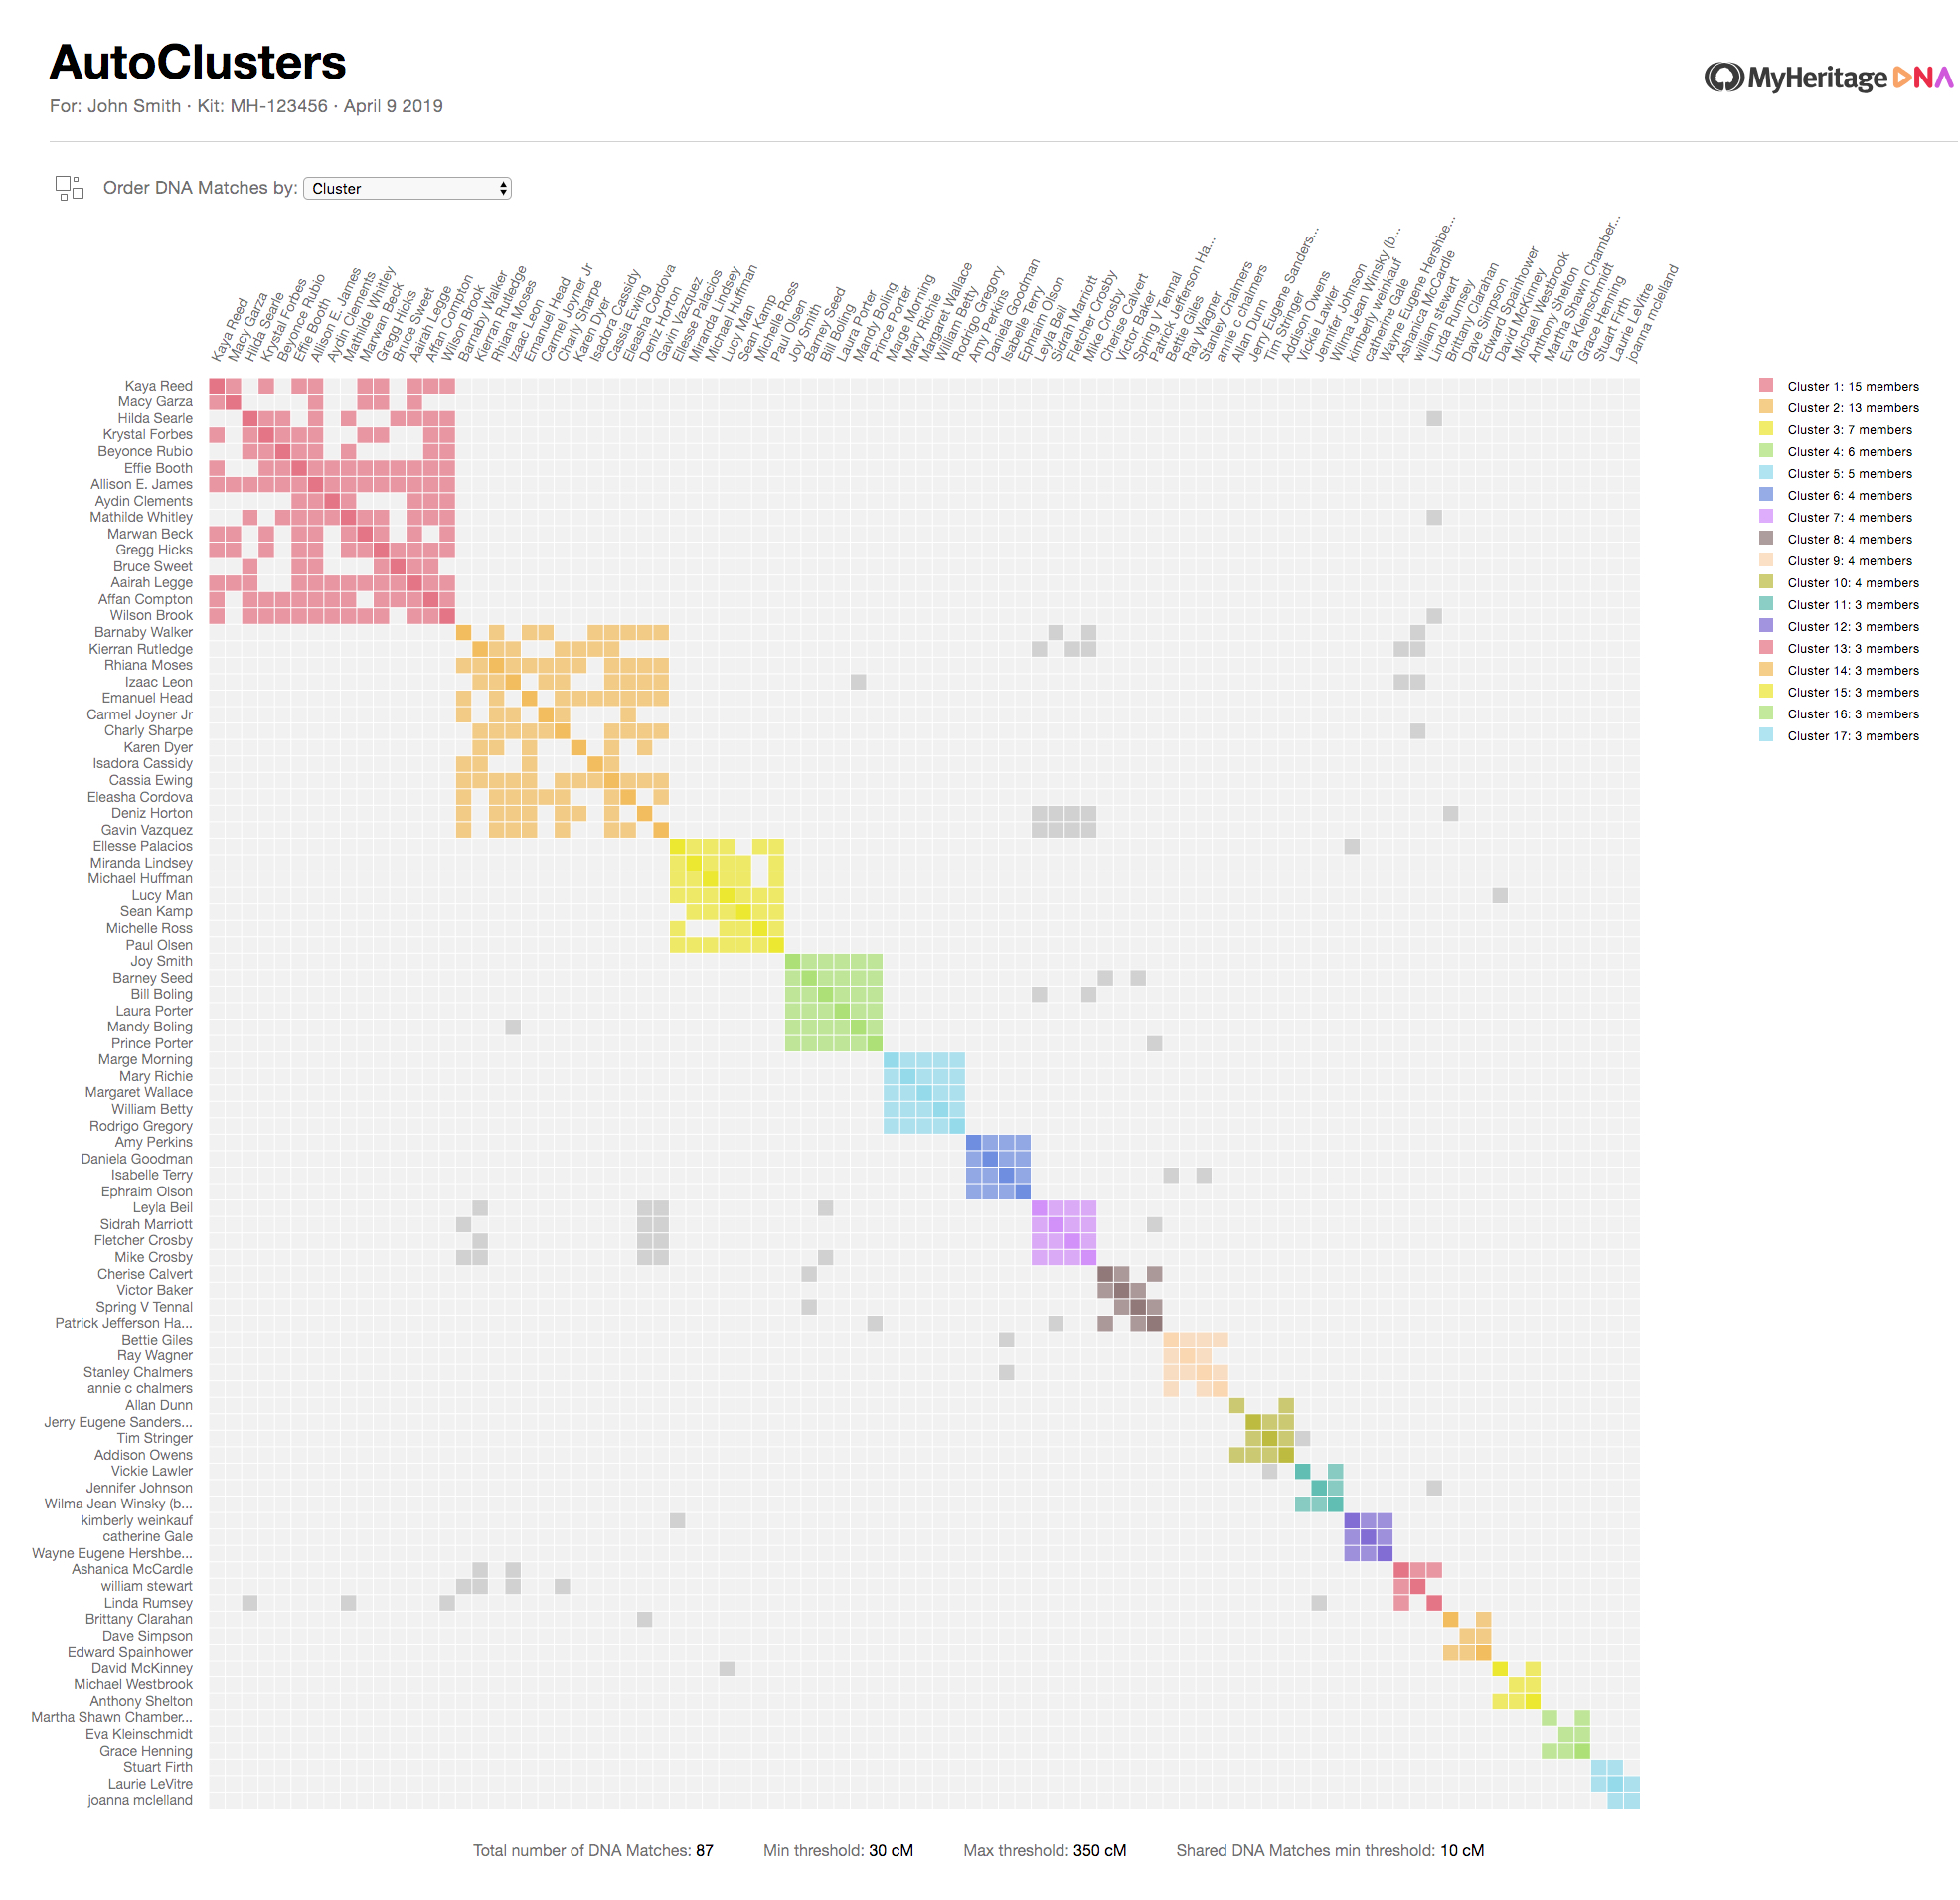
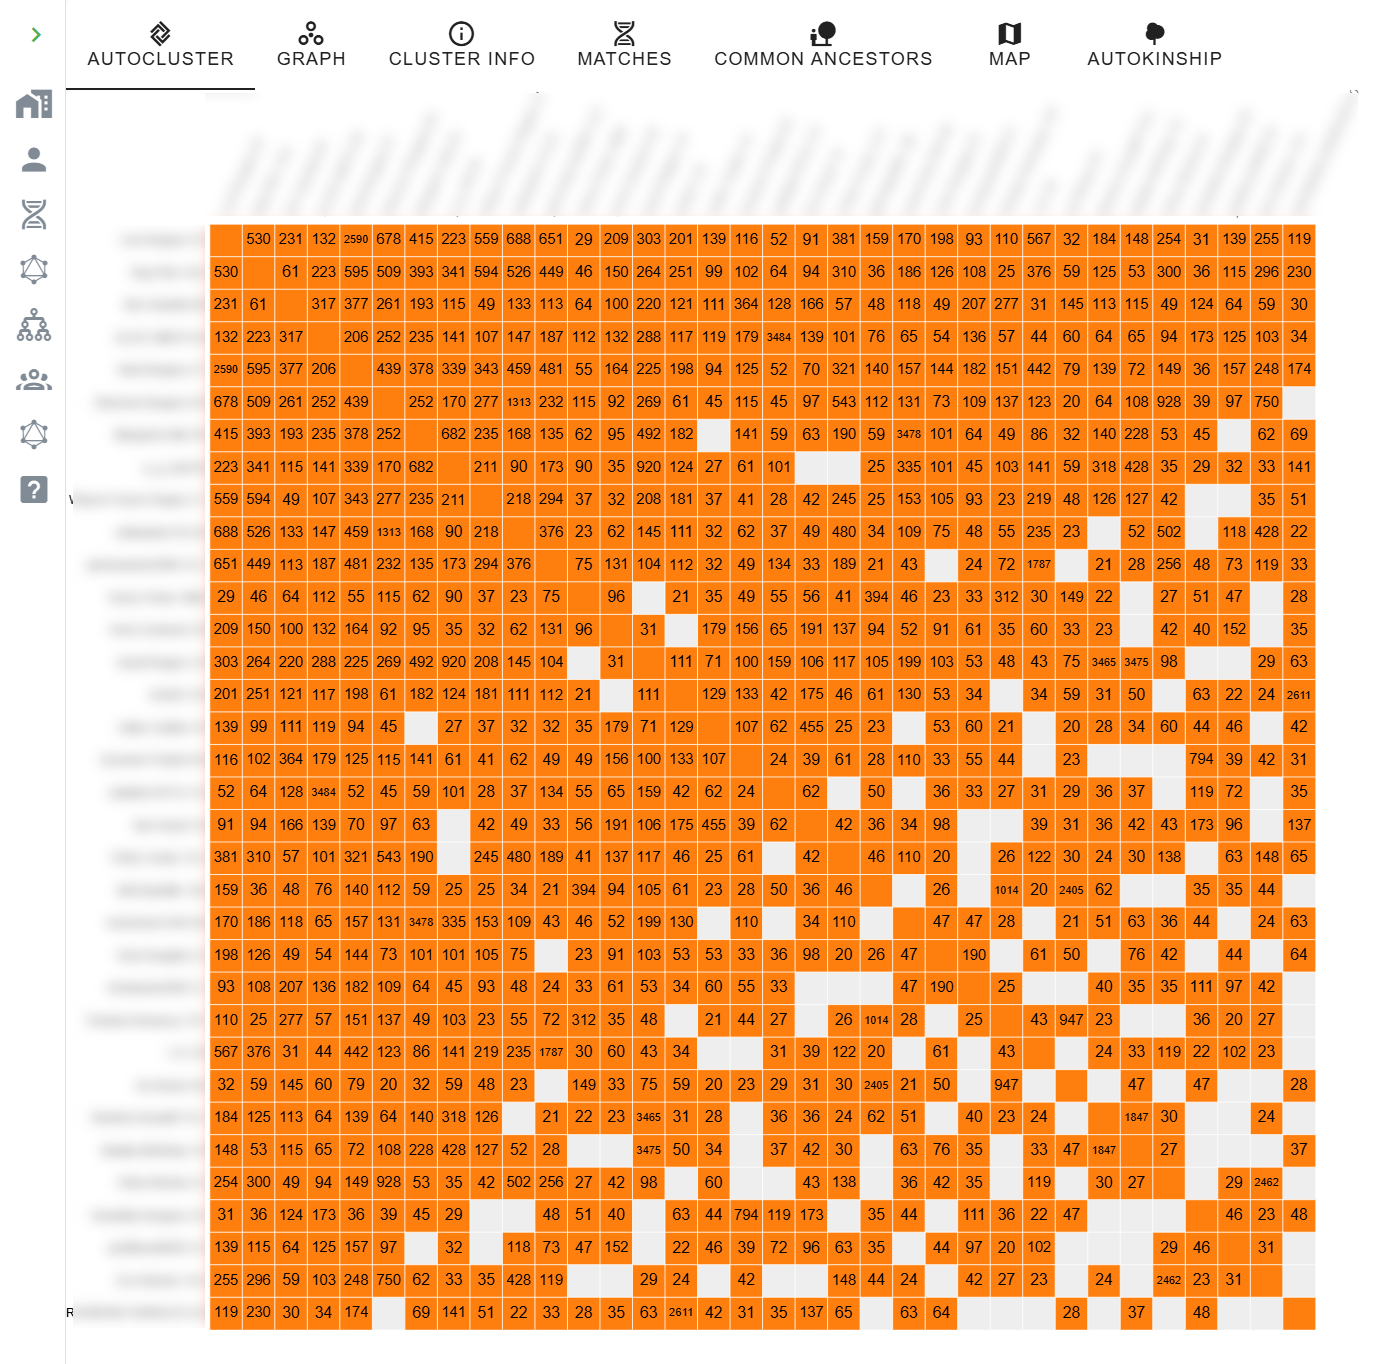
A cluster chart is a square grid. Every row is one of your DNA matches, and so is every column, the same people on both axes. Each cell in the grid represents the intersection between two of your matches.
- A coloured cell means the row match and the column match are shared matches of each other.
- An empty (light grey) cell means they are not shared matches, either because they genuinely belong to different branches, or because one of them shares too little DNA to show up on the other's match list.
- A darker grey cell outside a coloured block indicates a shared match that spans more than one cluster, typically a close cousin who is related to you through multiple lines.
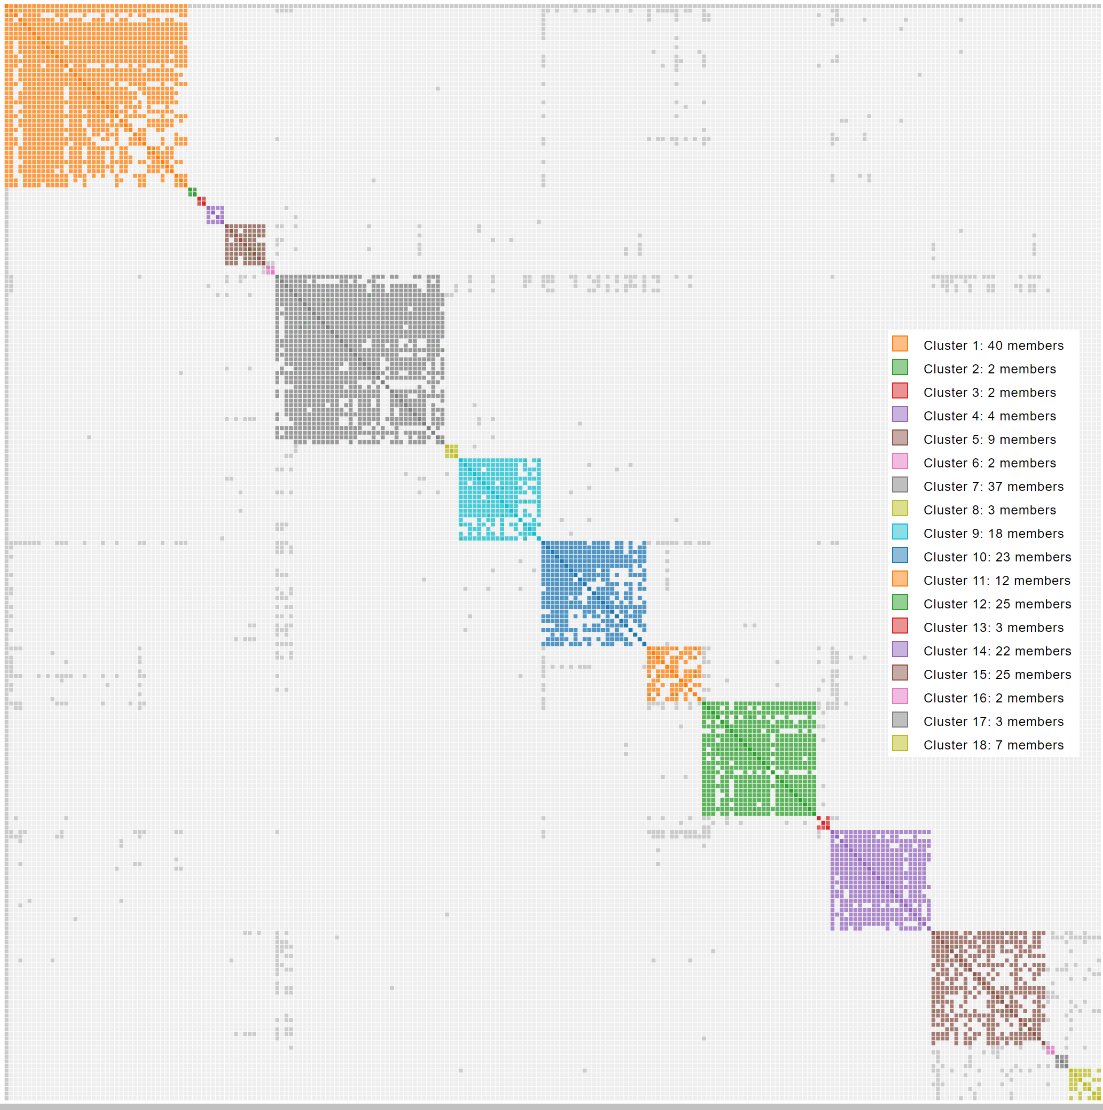
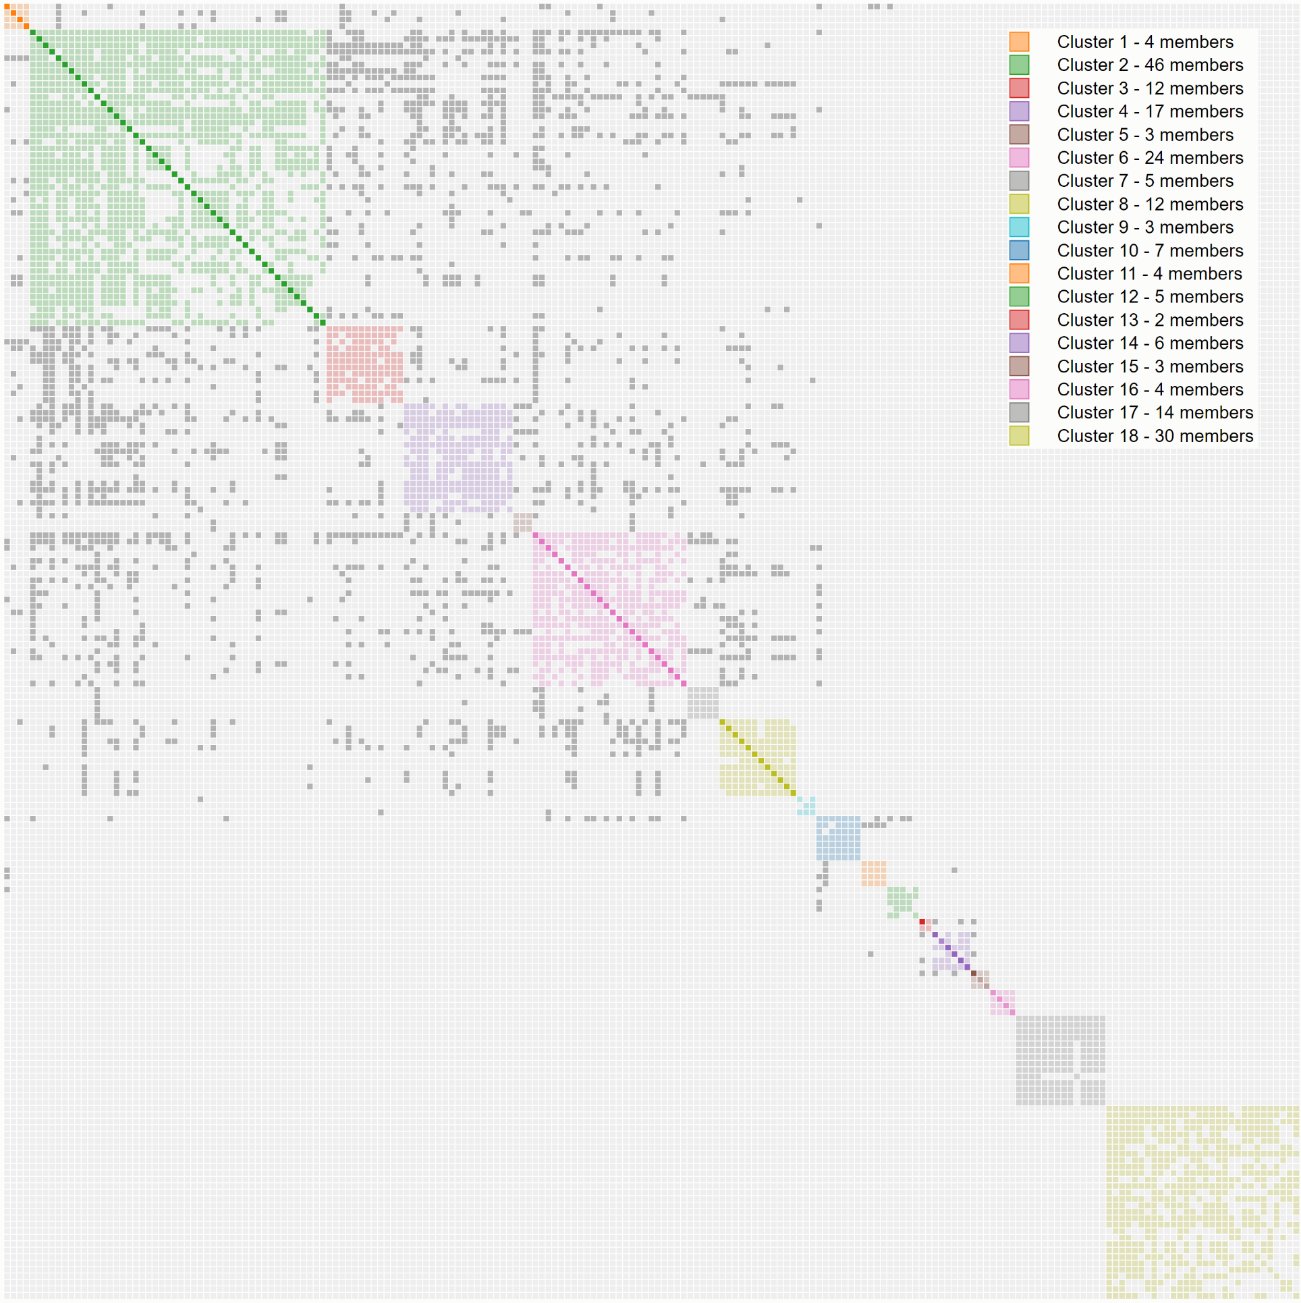
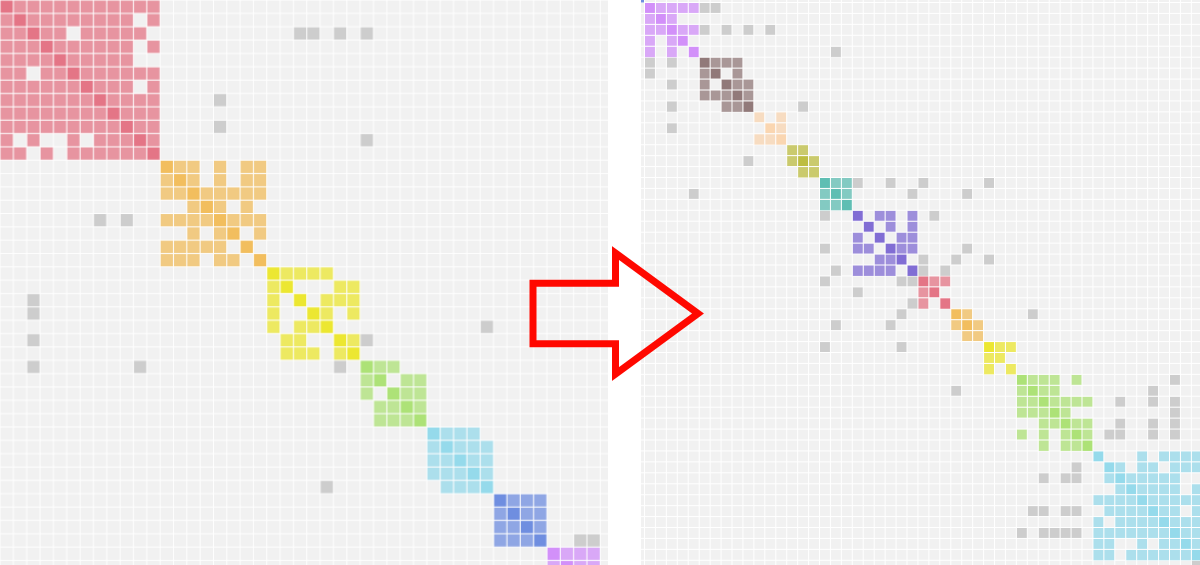
The clustering algorithm rearranges the clusters so that clusters whose members are densely connected to each other end up next to each other. The result is the characteristic diagonal of coloured squares: each square is a cluster, and the matches in that cluster form a dense little community of shared matches. Each cluster most often represents one of your ancestral lines.
A short history of DNA cluster analysis
The key idea, use shared matches to separate cousins into ancestral branches, has been stable for years. What has changed is the automation around it.
2018: The Leeds Method
In mid-2018, Dana Leeds published a remarkably simple procedure: take your closest AncestryDNA matches between roughly 90 and 400 cM, list them in a spreadsheet, and for each match, colour every shared match the same colour. Move down the list, pick a new colour for the next uncoloured match, colour all of their shared matches, and repeat. For most testers, four colours emerge, typically one per grandparent line. The technique is sometimes called DNA Color Clustering or the Color Cluster Method, but it is widely known as the Leeds Method.
Why the range of 90–400 cM? Lower than 90 cM and shared-match calls become unreliable; higher than about 400 cM and you run into close relatives who match you through multiple branches and would paint the whole tree the same colour. The Leeds Method works because in the 90–400 cM band, most matches are 2nd through 4th cousins, close enough for the shared-match relationship to be meaningful but distant enough to usually descend through a single grandparent.
The Leeds Method was a genealogy-community revelation precisely because it did not require a chromosome browser, a tree, or any segment maths. It worked on AncestryDNA, which provides none of those things, and it worked for adoptees and unknown-parentage cases as well as for people with rich family trees. Dana Leeds' original articles and follow-ups are linked in the references at the end of this chapter.
Late 2018: AutoCluster automates it
Evert-Jan Blom, the developer of Genetic Affairs, saw that the Leeds Method was essentially a community-detection problem and could be automated. In late 2018 he released AutoCluster, which did exactly what the Leeds Method did by hand, but automatically, for hundreds of matches at once, with a clean diagonal chart as output. Instead of the user colouring rows by inspection, a clustering algorithm reordered the matrix so that densely interconnected matches ended up next to each other, and each cluster received its own colour.
AutoCluster was initially available for AncestryDNA, FamilyTreeDNA and 23andMe.
In 2019 it reached a vastly wider audience when MyHeritage integrated it directly into their platform.
GEDmatch followed soon after as a Tier-1 tool. Ancestry took legal action in June 2020, formally demanding that Genetic Affairs stop automated retrieval of match data, ending third-party clustering support. Ancestry introduced its own match clusters in 2025.
2019: Linking clusters together
A first clustering pass groups closely-connected matches into individual clusters, but related clusters are not yet connected to each other. AutoCluster goes a step further: it examines the grey cells: matches that appear in more than one cluster, and uses them to determine which clusters are linked. Clusters that share enough inter-cluster connections are merged into a super-cluster: a larger grouping that may correspond to a grandparent line rather than a single ancestral couple.
2024–2025: Weighted clustering and large charts
The original AutoCluster treats every shared-match relationship as equal: either two matches share DNA or they don't. Weighted clustering, introduced in AutoLineage, uses the actual amount of DNA each pair of your matches shares with each other as input. Heavier connections (say, two cousins who share 120 cM with each other) pull matches more strongly together; lighter connections contribute less.
At the same time, AutoLineage has gained a large-chart mode that handles thousands of matches smoothly, so you are no longer limited to the 100-match charts of earlier AutoCluster runs. When the large chart is combined with MRCA labelling from imported trees, you end up with a full-tree panorama where every ancestral line is named.
From clusters to named ancestors
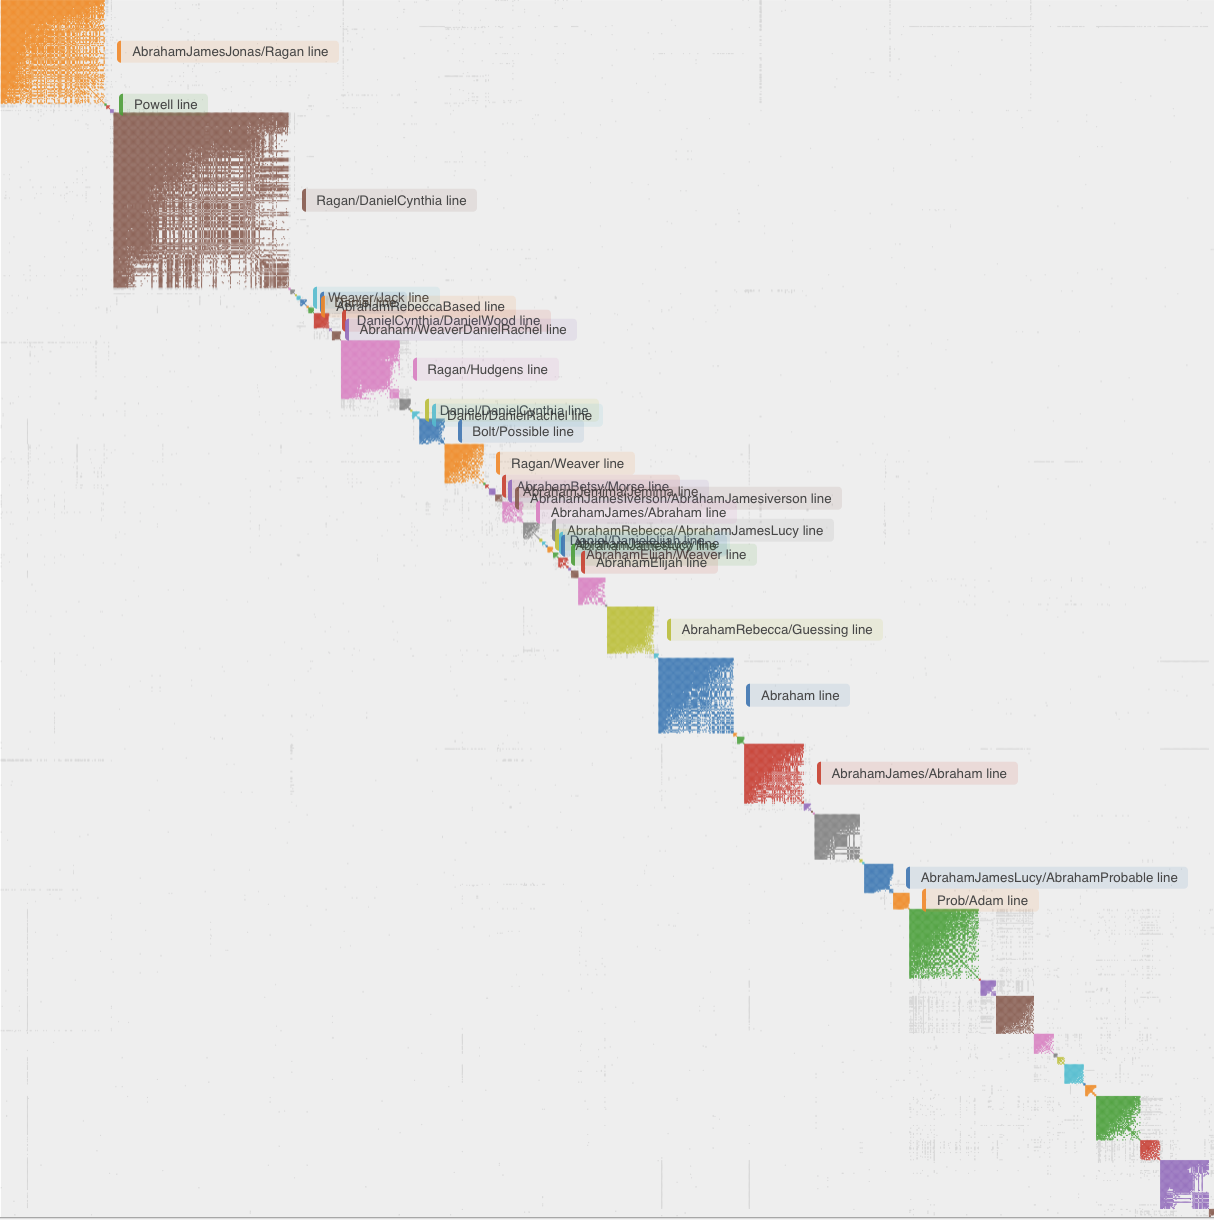
A cluster on its own is anonymous, it says "these people are related to you through one of your branches" without telling you which branch. Turning the cluster into a named ancestral line is where the other Genetic Affairs tools come in. AutoTree scans the trees attached to matches within each cluster and searches for common ancestors by comparing names, dates and places. AutoKinship goes further and predicts relationships from the amount of DNA the matches share with you and with each other, without needing any trees at all. AutoLineage combines both approaches and adds a crucial annotation step: when you have Most Recent Common Ancestor (MRCA) information recorded in the notes for your matches, each cluster can be labelled with the MRCA its members appear to descend from.
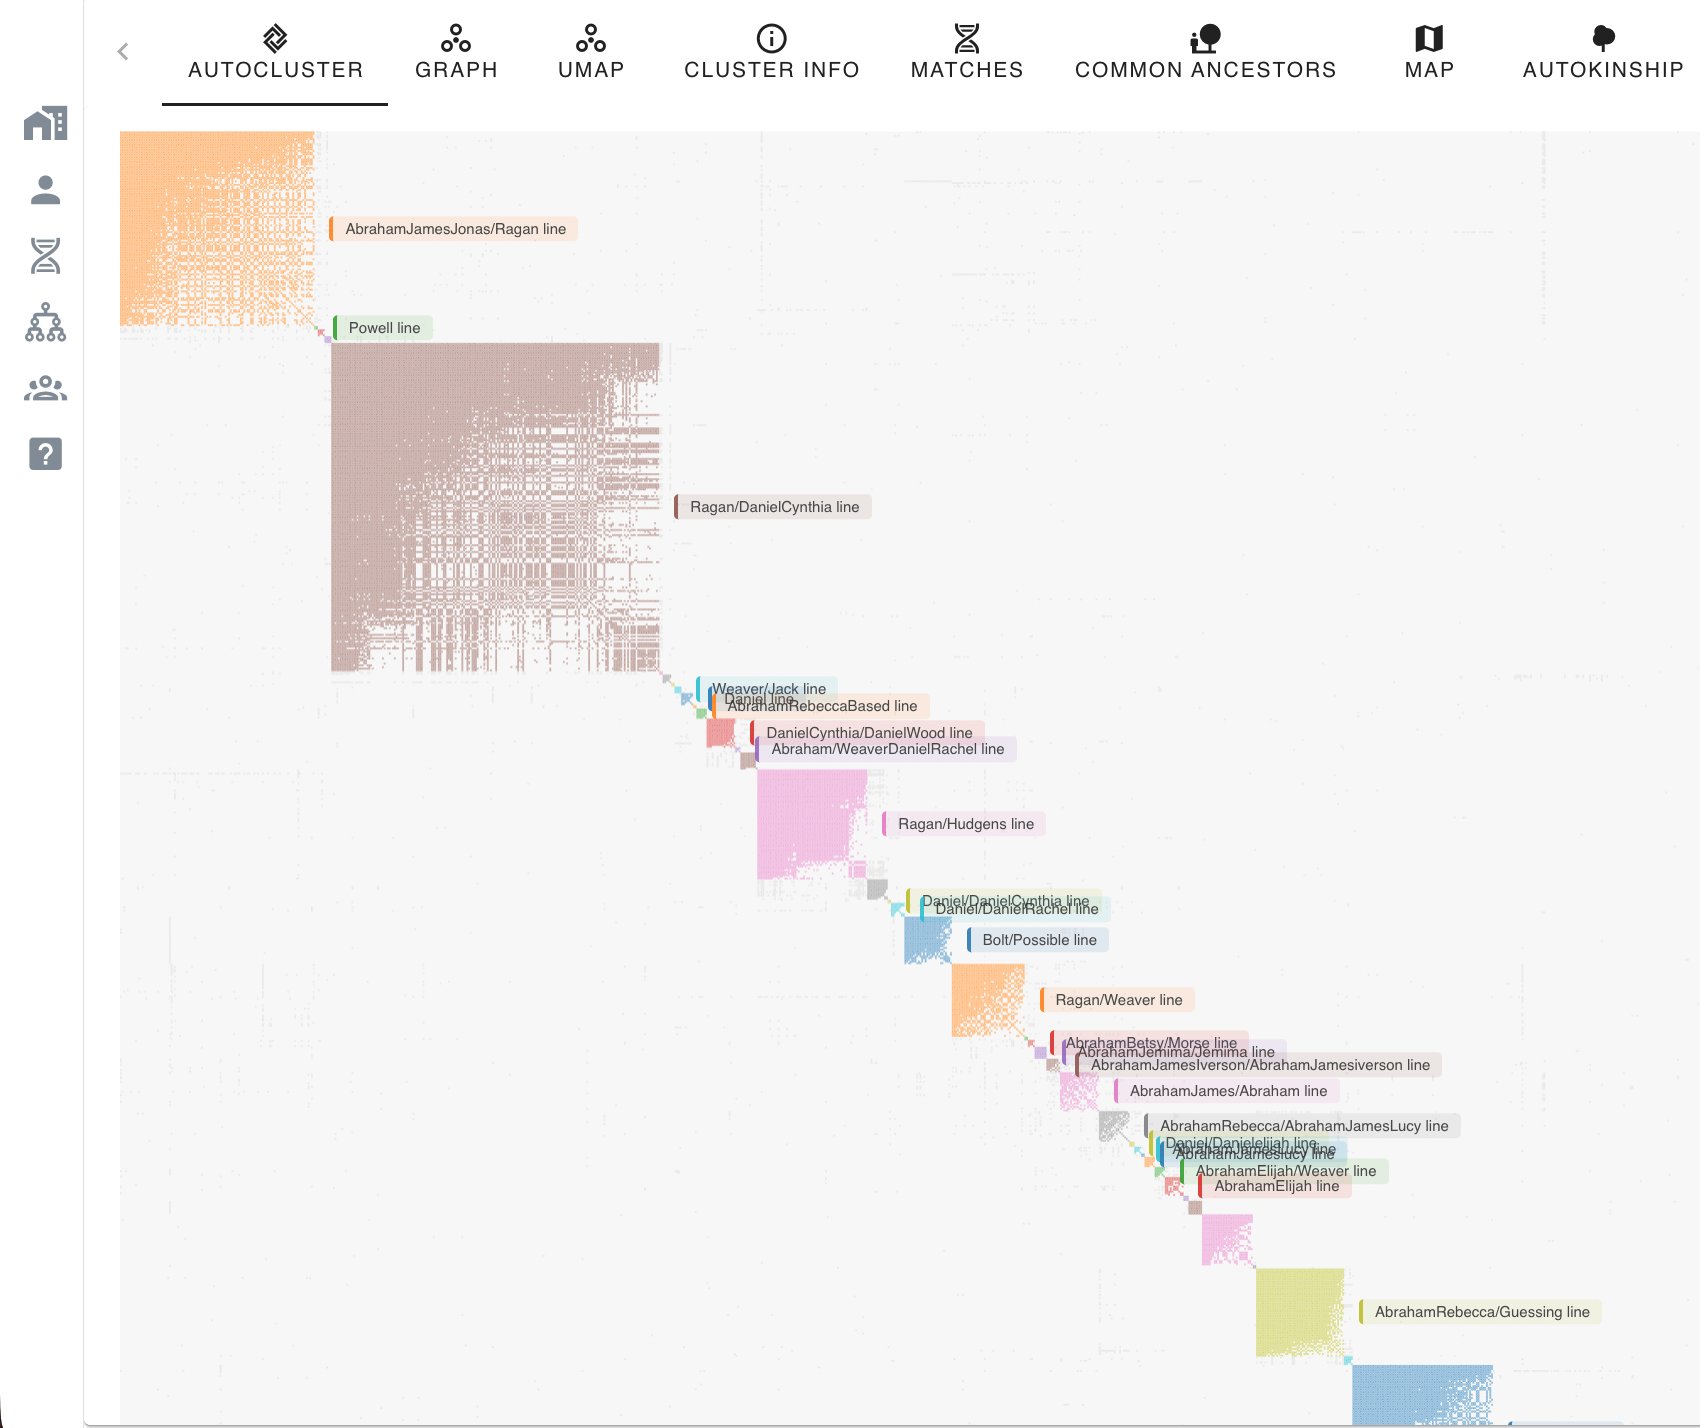
When a cluster is labelled in this way, reading the chart becomes a different exercise. Instead of asking "which branch could this be?", you ask "what does my Ragan/Daniel-Cynthia cluster look like, and which matches in it should I contact first?" The clustering has become a starting point for research, not an end in itself.
Shared cM between matches: a new dimension
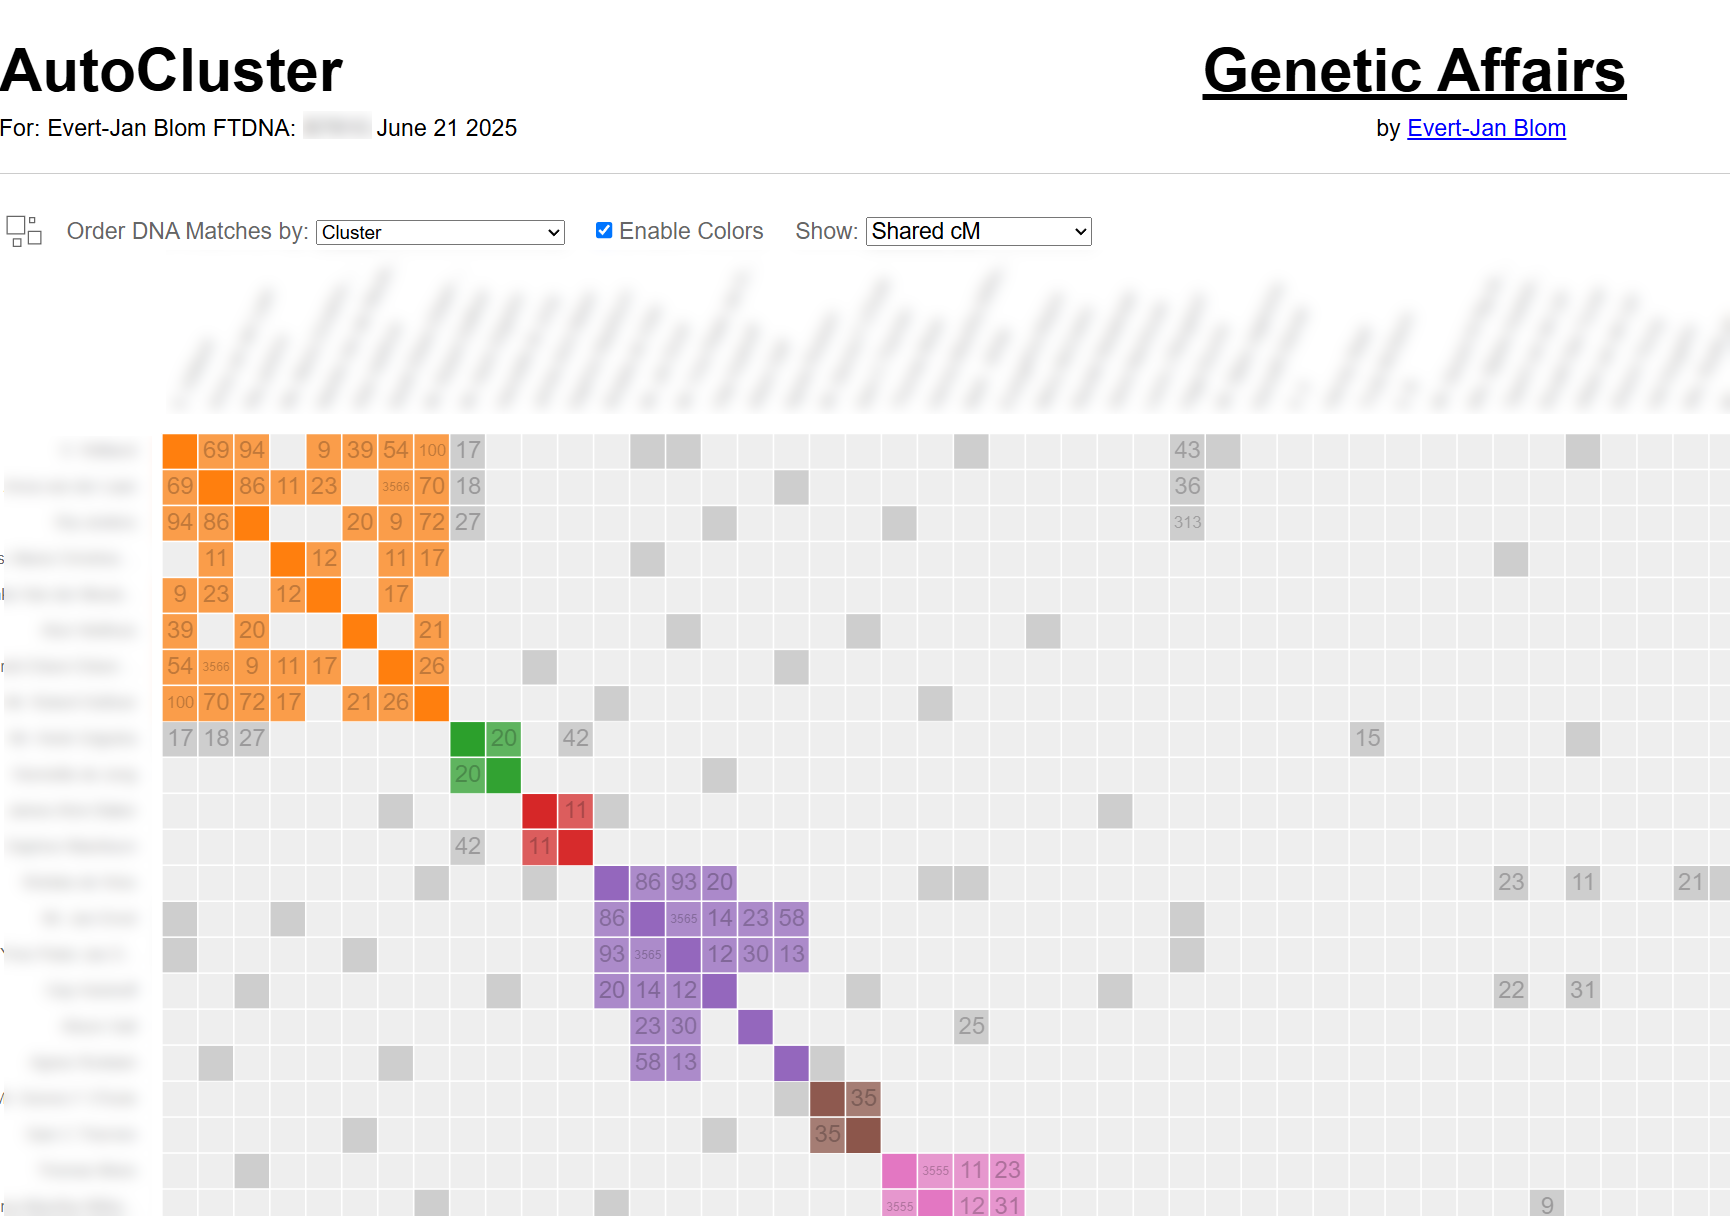
Early clustering relied solely on whether two of your matches share DNA with each other, a yes-or-no signal. A significant step forward came when testing companies began publishing not just who your shared matches are, but how much DNA those shared matches share with each other. MyHeritage, GEDmatch and 23andMe provided this inter-match cM data from early on. Ancestry added it more recently, and FamilyTreeDNA has now followed, meaning that today, for the first time, all major testing companies supply this information.
This fundamentally changes what is possible inside a cluster. Instead of knowing only that matches A, B and C belong together, you now know that A and B share 220 cM with each other, while B and C share only 38 cM. That extra layer of evidence makes it possible to identify relationships within clusters: not just which branch a cluster represents, but how the individuals in it relate to each other and to you.
Genetic Affairs visualises the inter-match shared cM directly on the cluster chart: each coloured cell carries the cM value between the two matches it represents. The matrix below the diagonal makes the relationship structure visible at a glance.
AutoKinship: reconstructing trees from shared DNA
Having inter-match cM data for every pair of matches in a cluster opens the door to automated relationship prediction. AutoKinship takes the full matrix of shared cM values and infers a family tree that is consistent with those numbers, without needing any attached trees or known ancestors. It works on any company that provides inter-match cM data, including GEDmatch.
AutoLineage: adding MRCA information and known relationships
AutoLineage takes reconstruction further by allowing you to feed in known relationships and MRCA information from imported trees. Where AutoKinship predicts structure from numbers alone, AutoLineage lets you anchor that structure to real ancestors, confirming, refining or extending the predicted tree with documented genealogical evidence.
Three things to keep in mind
Clustering is powerful but not magical. Three caveats are worth internalising:
- Close matches link multiple clusters. Parents, siblings, aunts and uncles, and often first cousins share DNA with people on both sides of your family, so they appear as grey cells that bridge several clusters rather than sitting neatly inside one. Far from reducing clustering quality, this is actually useful information: the clusters a close match links to reveal which ancestral lines that person is connected to. The automated Genetic Affairs tool defaults to an upper cM threshold of 600 cM, but including close matches above that threshold can help you orient clusters relative to known relatives.
- Endogamy produces mega-clusters. In populations where intermarriage within a community has been common for generations, Ashkenazi Jewish, Acadian, Amish, Polynesian, and others, nearly every DNA match shares DNA with nearly every other, and the cluster chart becomes one large interrelated square. Endogamy-aware tuning (higher minimum cM, minimum-largest-segment filters) helps but does not fully eliminate the effect.
- A cluster is a lineage, not always a single ancestor. The matches in one cluster descend from a common branch, but not necessarily all from the same MRCA. Your 2nd cousin descends from your great-grandparents; your 3rd cousin in the same cluster descends from your 2×-great-grandparents. Both appear in the same cluster because both are on the same branch of your tree, but the MRCA varies by match. Weighted clustering and MRCA labelling help untangle this, but the underlying fact, cluster ≈ lineage, not cluster = single ancestor, is worth remembering when you interpret a chart.
References
The following blog articles, listed chronologically, trace the arc of cluster analysis from Dana Leeds' original method to today's weighted clustering with MRCA annotations.
The Leeds Method
- DNA Color Clustering: The Leeds Method for Easily Visualizing Matches The canonical introduction to the Leeds Method, with the 90–400 cM rule and the four-colour logic that anticipates four grandparent lines.
- Consolidating Clusters: An Example A worked example of merging overlapping colour groups back down to the four grandparent clusters, the manual counterpart of what weighted clustering now does automatically.
- The Leeds Method Roberta's walkthrough of Dana's method, the article that brought the Leeds Method to a mainstream genealogy audience.
AutoCluster automates the spreadsheet
- AutoClustering by Genetic Affairs The launch review of AutoCluster, what clusters are, how they form, and why they are useful for genealogy.
- Introducing AutoClusters for DNA Matches MyHeritage's announcement of AutoClusters natively integrated into their platform, with endogamy-aware tuning.
- Utilizing MyHeritage AutoClusters to Analyze your DNA Matches Step-by-step interpretation of a MyHeritage AutoCluster chart, paired with Theories of Family Relativity and shared-ancestral-surnames.
Understanding and interpreting clusters
- Comparison of ICW AutoCluster and AutoSegment AutoCluster Shared-match clustering vs segment-based clustering on the same data, useful for knowing which tool to reach for on a given problem.
- Improved AutoCluster clustering on GEDmatch Walkthrough of the GEDmatch Tier-1 AutoCluster with automatic AutoTree generation from match GEDCOMs.
- Exploring AutoClusters A practical exploration of what a cluster actually tells you, and the crucial point that within a single cluster the MRCA can vary by match.
Modern clustering: weighted, large, and MRCA-annotated
- AutoLineage The launch article for AutoLineage, cross-company clustering, MRCA discovery across multiple testing sites, and the unified profile concept.
- Exhaustive MRCA Analysis for GEDmatch Matches Running MRCA analysis against up to 7,500 matches via the GEDmatch Tier-1 import, the largest-scale common-ancestor search available in AutoLineage.
- New Copy and Paste Option in AutoLineage Patricia's introduction of the weighted-clustering option, with the Dave Coleman / Duff case study showing how weighted clustering resolves structure unweighted clustering missed.
- AutoKinship by Genetic Affairs Builds Family Trees from Your Matches at FamilyTreeDNA, and More Current end-to-end walkthrough of the modern FTDNA workflow, from automated clustering through AutoKinship to refined tree reconstruction and MRCA integration in AutoLineage.
Tool pages
- Genetic Affairs, public website Main information page with descriptions of every tool and current pricing.
- Genetic Affairs, members site Where you register kits, run analyses and access AutoLineage.
- AutoLineage The AutoLineage workbench, cross-company clustering, tree import, common-ancestor detection and tree reconstruction.
AutoCluster
What it does
AutoCluster groups your DNA matches into coloured shared-match clusters that typically represent branches of your family tree. Each coloured cell sits at the intersection between two matches who both match you and each other. Cells of the same colour, plus the grey cells that link them, form a cluster likely descended from a common ancestral couple.
Where it runs
- FamilyTreeDNA: from the members site after kit registration.
- MyHeritage: embedded natively in your MyHeritage account (~100 matches per chart; endogamy-aware).
- GEDmatch (Tier 1): embedded at GEDmatch.
- CSV upload for any source, and AutoFastCluster for instant in-browser clustering.
Step-by-step (FTDNA)
- From your Profiles page, click Start analysis and select AutoCluster.
- Set max and min shared cM (e.g. 600 / 50), minimum cluster size (2 or 3), and optionally a minimum largest-segment size. Tick Enable AutoTree in the same run (recommended).
- Choose match selection, all matches, or start with specific matches of interest.
- Enter your FTDNA password and your 2FA code if enabled.
- Review the credit cost and click Perform analysis. The ZIP arrives via email and can also be downloaded from the notifications panel in the top right of the site.
Reading the output
The ZIP contains a main HTML chart, an Excel spreadsheet with the same
data (useful when the HTML is huge), a gephi folder with
nodes.csv and edges.csv (used later by
AutoLineage), chromosome browser files, and a secondary tables-only
HTML.
On the chart, grey cells are shared matches spanning more than one cluster. Clusters are sorted using these greys, which produces the characteristic super-cluster shape. Below the chart, a sortable table lists each match with shared cM, cluster, tree size, predicted relationship and notes.
Starting with specific matches of interest
Instead of running on all matches, you can focus a run on specific matches of interest, useful for zooming in on the branches you share with one particular cousin.
-
Run a normal AutoCluster first, unzip, and find the ResultID2 of the
match of interest in the matches CSV (in the
gephifolder). - Run AutoCluster again, choose Start with specific matches of interest, and paste the ResultID2.
-
To exclude specific matches:
!XYZremoves the match;!!XYZremoves the match and their entire branch.
Tips
- Start with a higher minimum cM (50 cM+) and lower it on later runs once you know the size of your match list.
- Endogamy: prefer MyHeritage's embedded version for endogamous ancestry, or use the "more powerful server" option on the Genetic Affairs site.
- Set up Family Matching (bucketing) at FTDNA before your run, your chart will then show P/M labels per match.
AutoTree
What it does
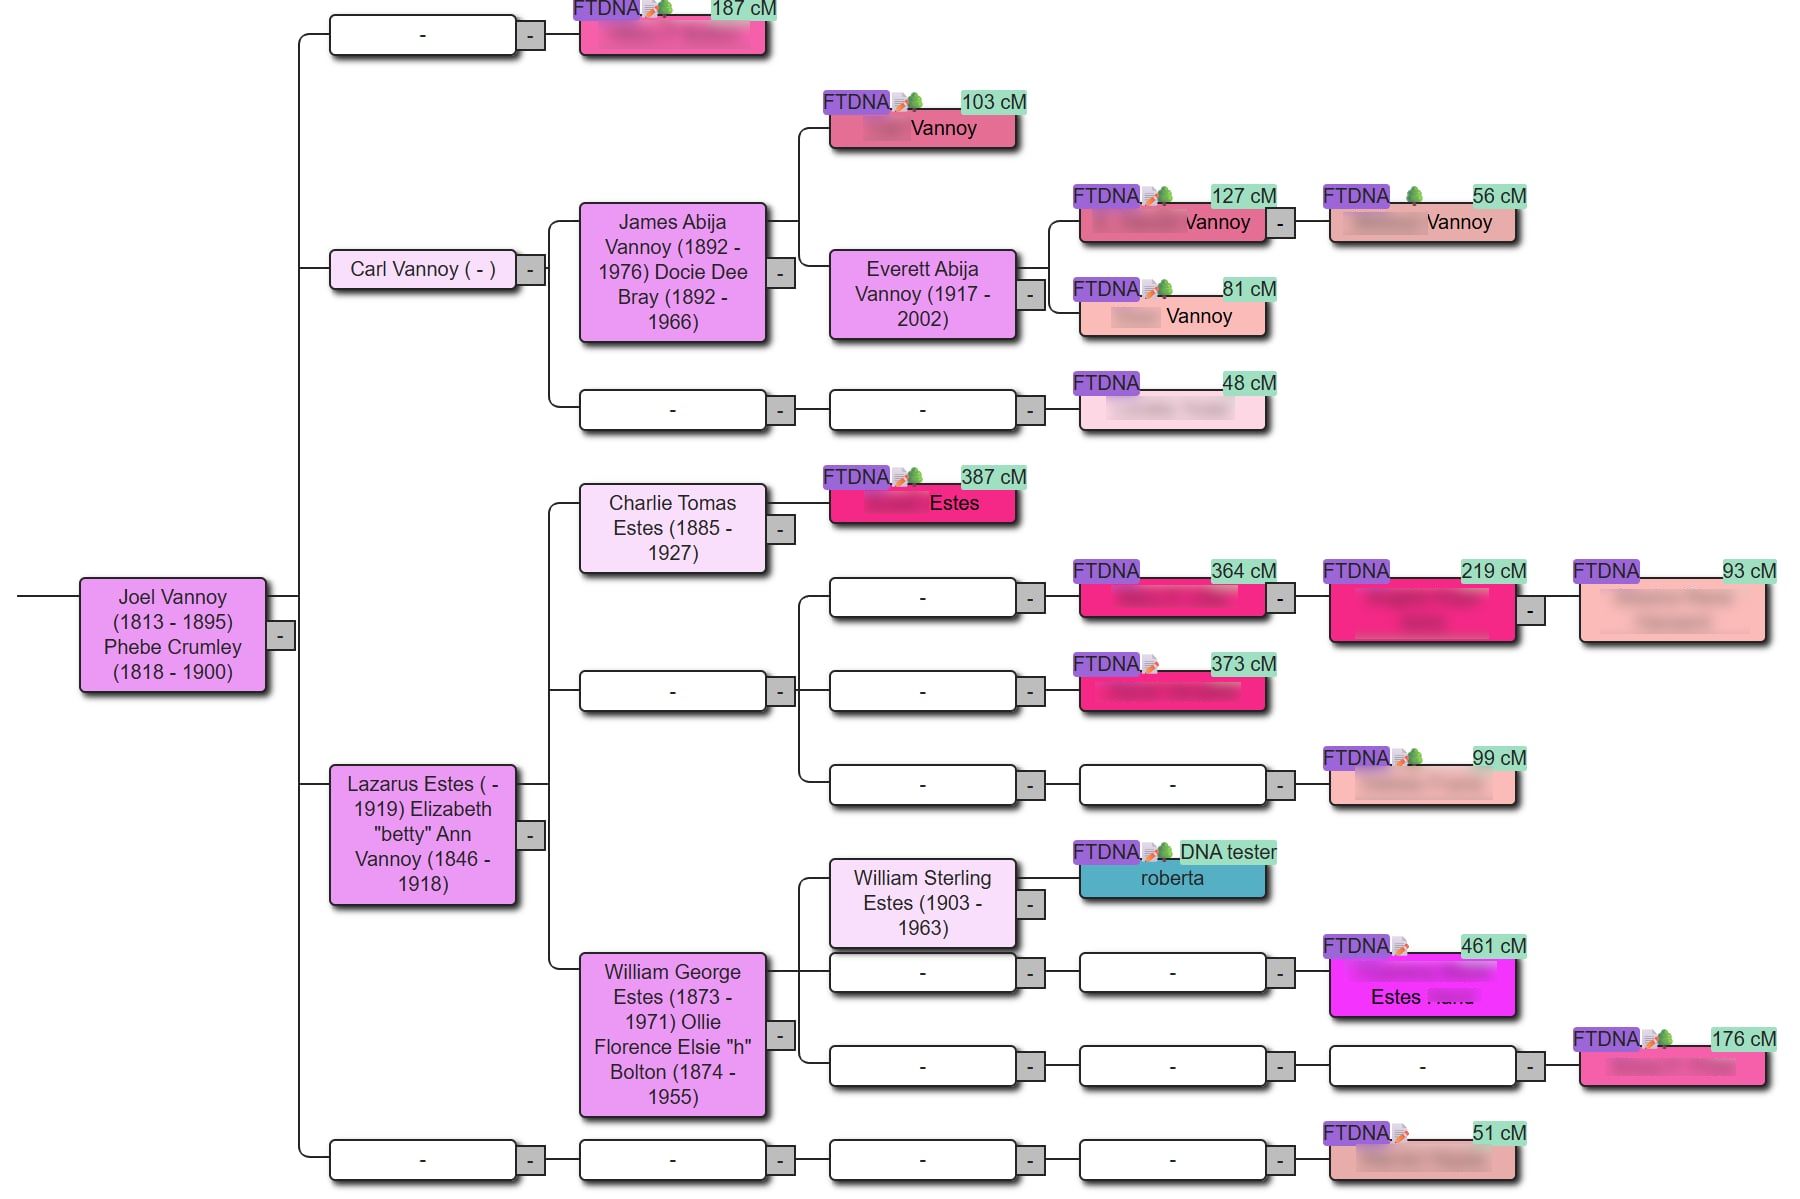
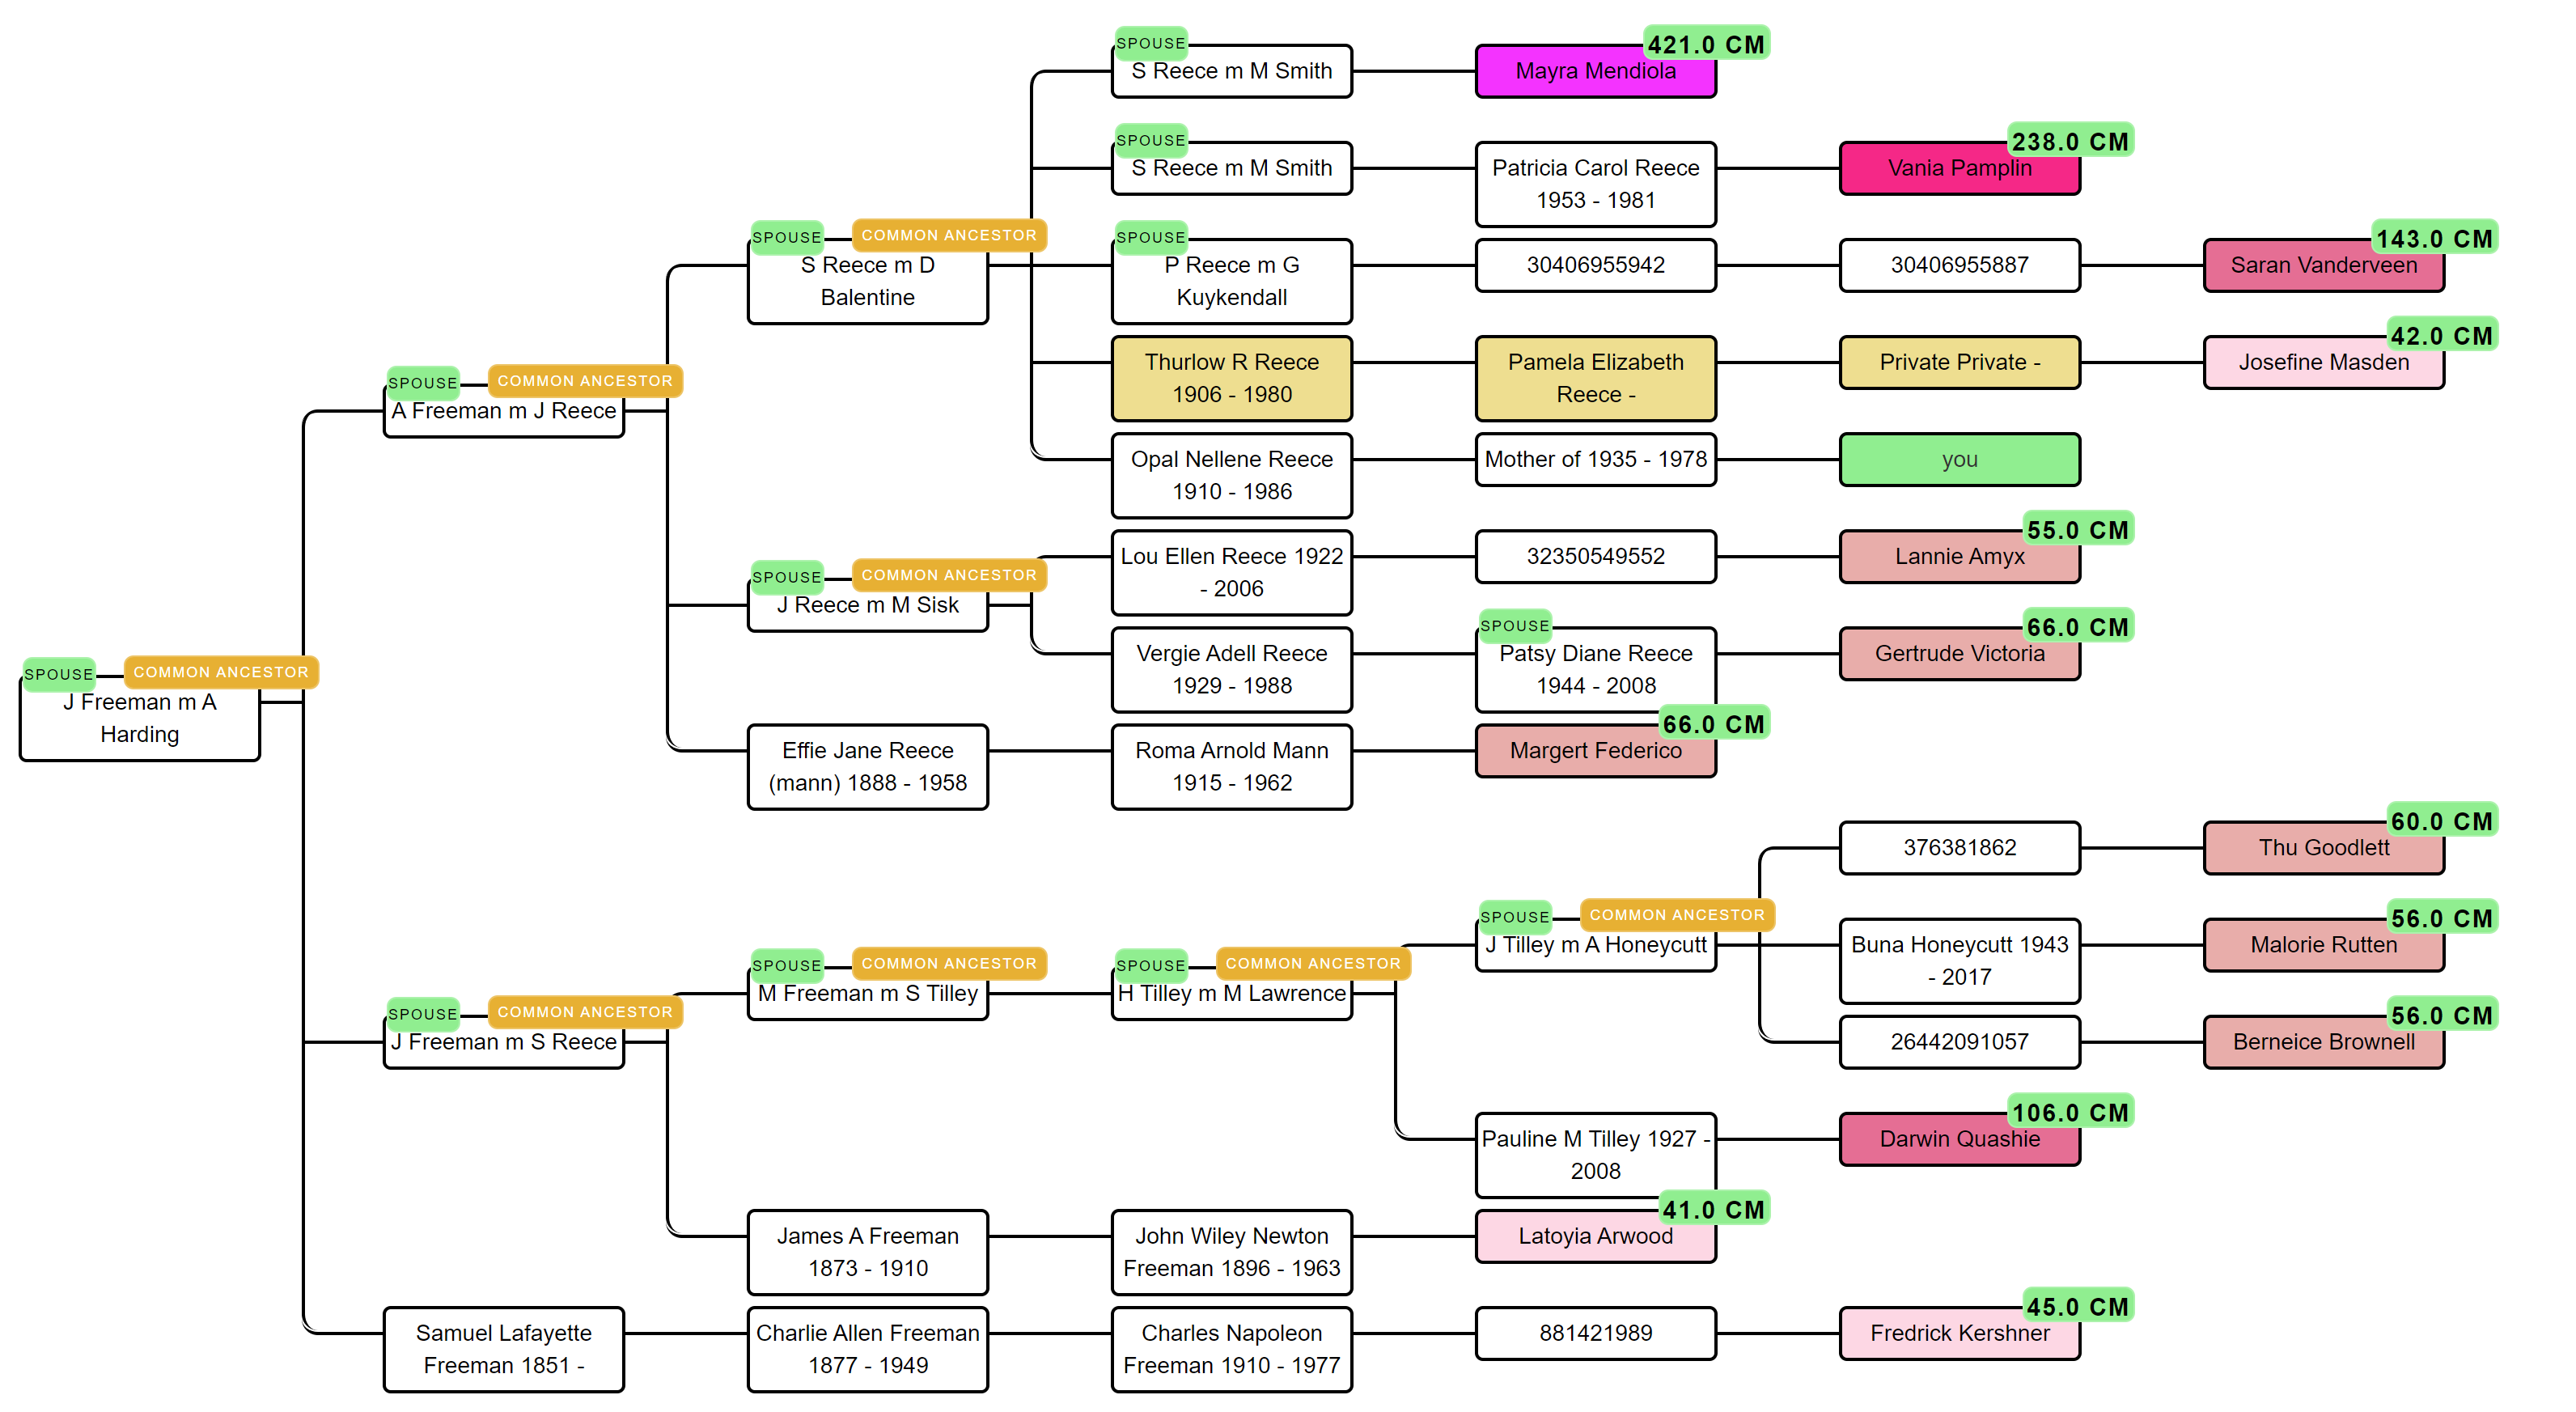
AutoTree reads every available tree attached to matches in each cluster, clusters tree persons by surname → first name → birth/death year, and identifies the most likely common ancestors. It then reconstructs partial genealogical trees from each common ancestor down to the matches. AutoTree works even if you don't have a tree, it's especially useful for adoptees.
Where it runs
AutoTree runs directly only on FamilyTreeDNA. For 23andMe, MyHeritage and Ancestry, use AutoLineage instead; AutoLineage's common-ancestor detection is the modern replacement.
Step-by-step (FTDNA)
AutoTree can be run on its own or combined with AutoCluster in a single pass (recommended, you get both results for one job).
- From your Profiles page, click Start analysis and select AutoTree: or tick Enable AutoTree when setting up an AutoCluster run.
- Set the cM range parameters for the matches whose trees you want to read.
- Choose match selection, all matches, or start with specific matches of interest.
- Enter your FTDNA password and your 2FA code if enabled.
- Review the credit cost and click Perform analysis. The ZIP arrives via email and can also be downloaded from the notifications panel in the top right of the site.
Output
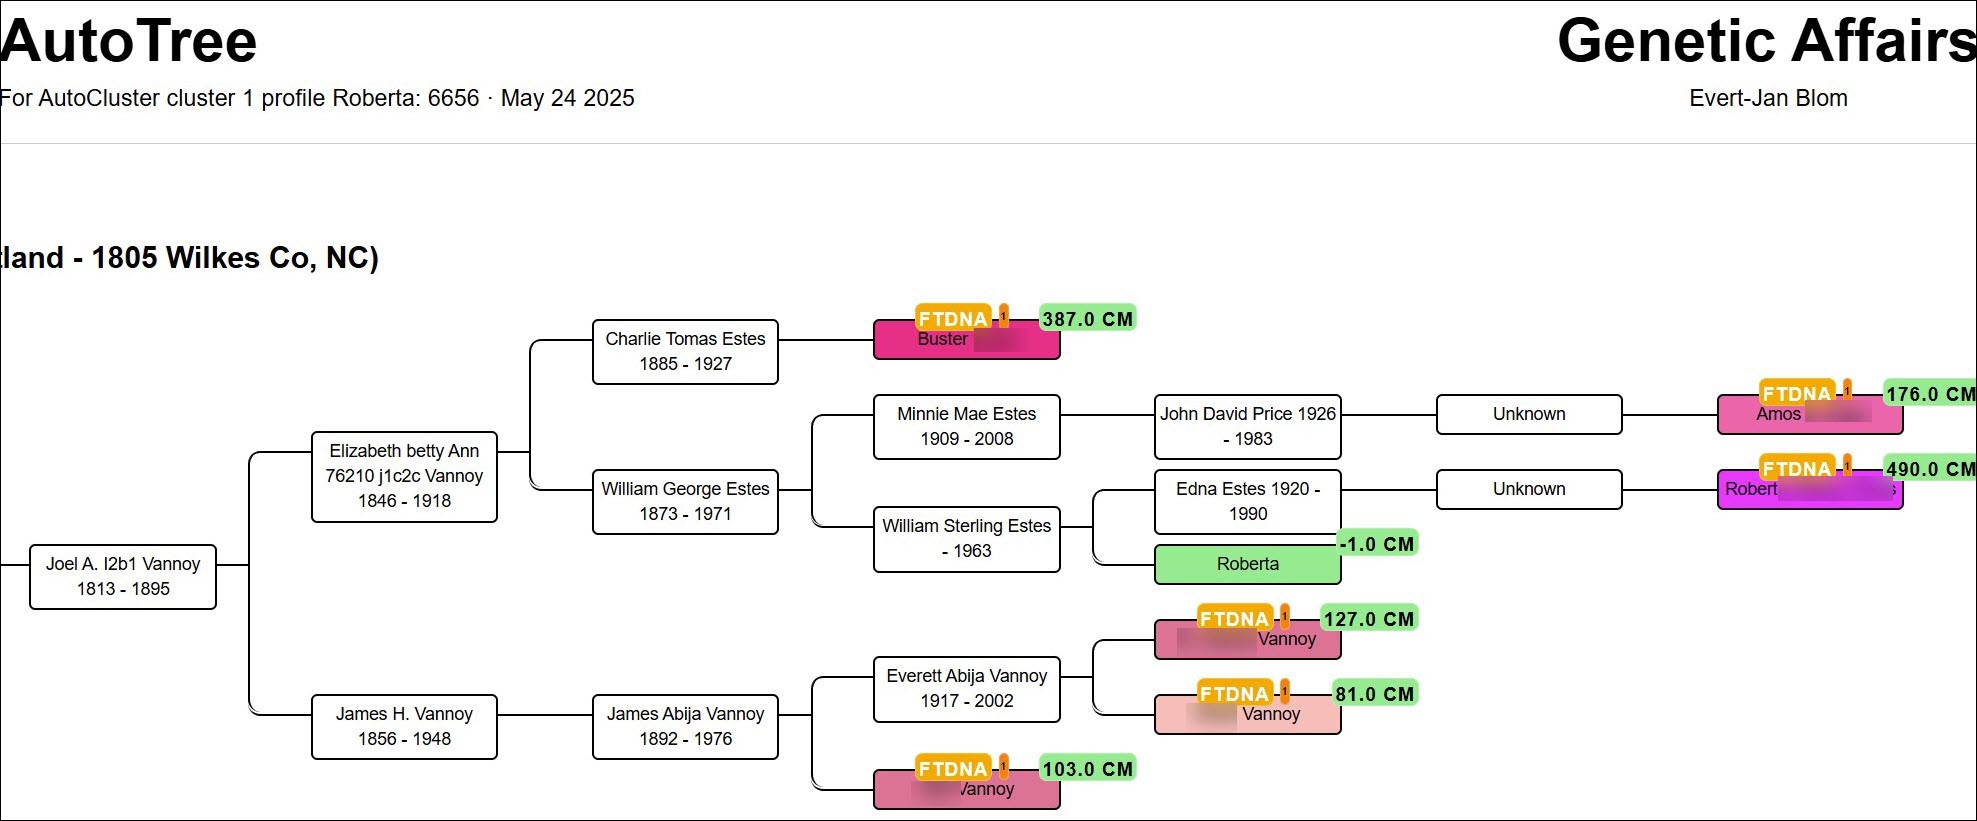
The top-level HTML report includes an overview table. For each cluster, three links take you deeper:
- FamilyTreeDNA Trees of Cluster #
- Common Ancestors of Cluster #: MRCAs with spouses, descendants and linked matches.
- Common Locations of Cluster #: geographic clusters of birth locations.
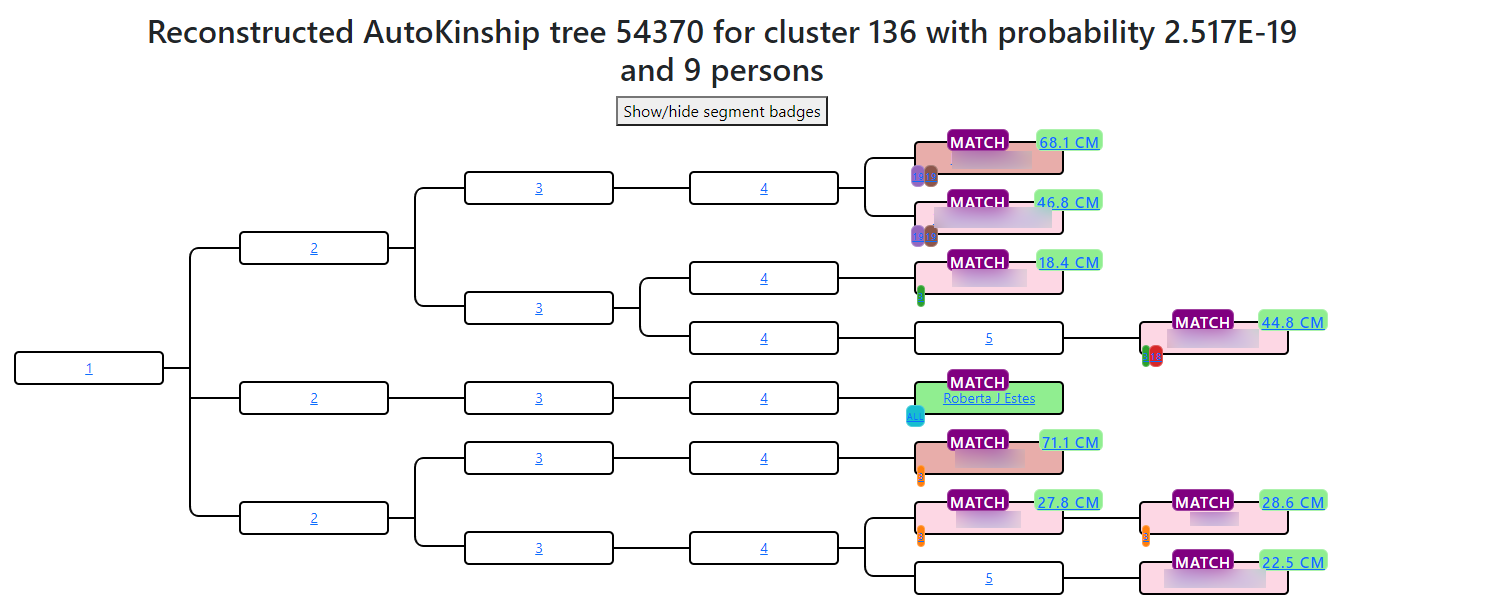
Reconstructed trees colour-gradient matches by cM (the strongest matches pop visually). The tester appears in green. Hover an edge to highlight the same person in multiple trees; click a cM value for Shared cM Project 3.0 v4 relationship probabilities.
Tips
- Encourage matches to attach trees at FTDNA, AutoTree's quality is tree-driven.
- Reconstructed trees are partial. A little manual stitching across them often produces a useful combined chart.
AutoSegment
What it does
AutoSegment groups matches by overlapping DNA segments on specific chromosomes, a different question from "do these people match each other?" It identifies who shares the same stretch of a chromosome.
The offline-file situation
As of April 2026, most offline segment files can no longer be downloaded from the testing companies. 23andMe's security changes blocked bulk segment export; MyHeritage and others have tightened access.
The offline AutoSegment workflow is still supported, but in practice it's now mainly useful to people who already saved those files on their computer in earlier years. New users starting in 2026 will generally only be able to use AutoSegment on data still obtainable, most reliably FTDNA Family Finder and GEDmatch Tier 1 exports.
Step-by-step: automated AutoSegment (FTDNA)
The automated AutoSegment works exclusively with FTDNA profiles registered on Genetic Affairs.
- From your Profiles page, click Start analysis and select AutoSegment ICW.
- Set the minimum segment overlap threshold (10 cM is a solid starting point). Optionally enable pile-up filtering.
- Choose match selection, all matches, or start with specific matches of interest.
- Enter your FTDNA password and your 2FA code if enabled.
- Review the credit cost and click Perform analysis. The ZIP arrives via email and can also be downloaded from the notifications panel in the top right of the site.
Offline workflow (for files you already have)
If you still hold older CSVs: on the landing page, click Run AutoSegment, choose the source company, and upload match and segment files. For GEDmatch, upload the Triangulation CSV too, this unlocks the triangulation-verified version. You can add paternal/maternal labels manually in the last column of the match CSV before upload.
Hybrid AutoSegment
Hybrid AutoSegment combines segment data across multiple companies in one chart. FTDNA liftover harmonises coordinates. Labels on the chart show each company's contribution, and a table shows match counts per company. Hybrid AutoSegment shines when you already hold data from several companies.
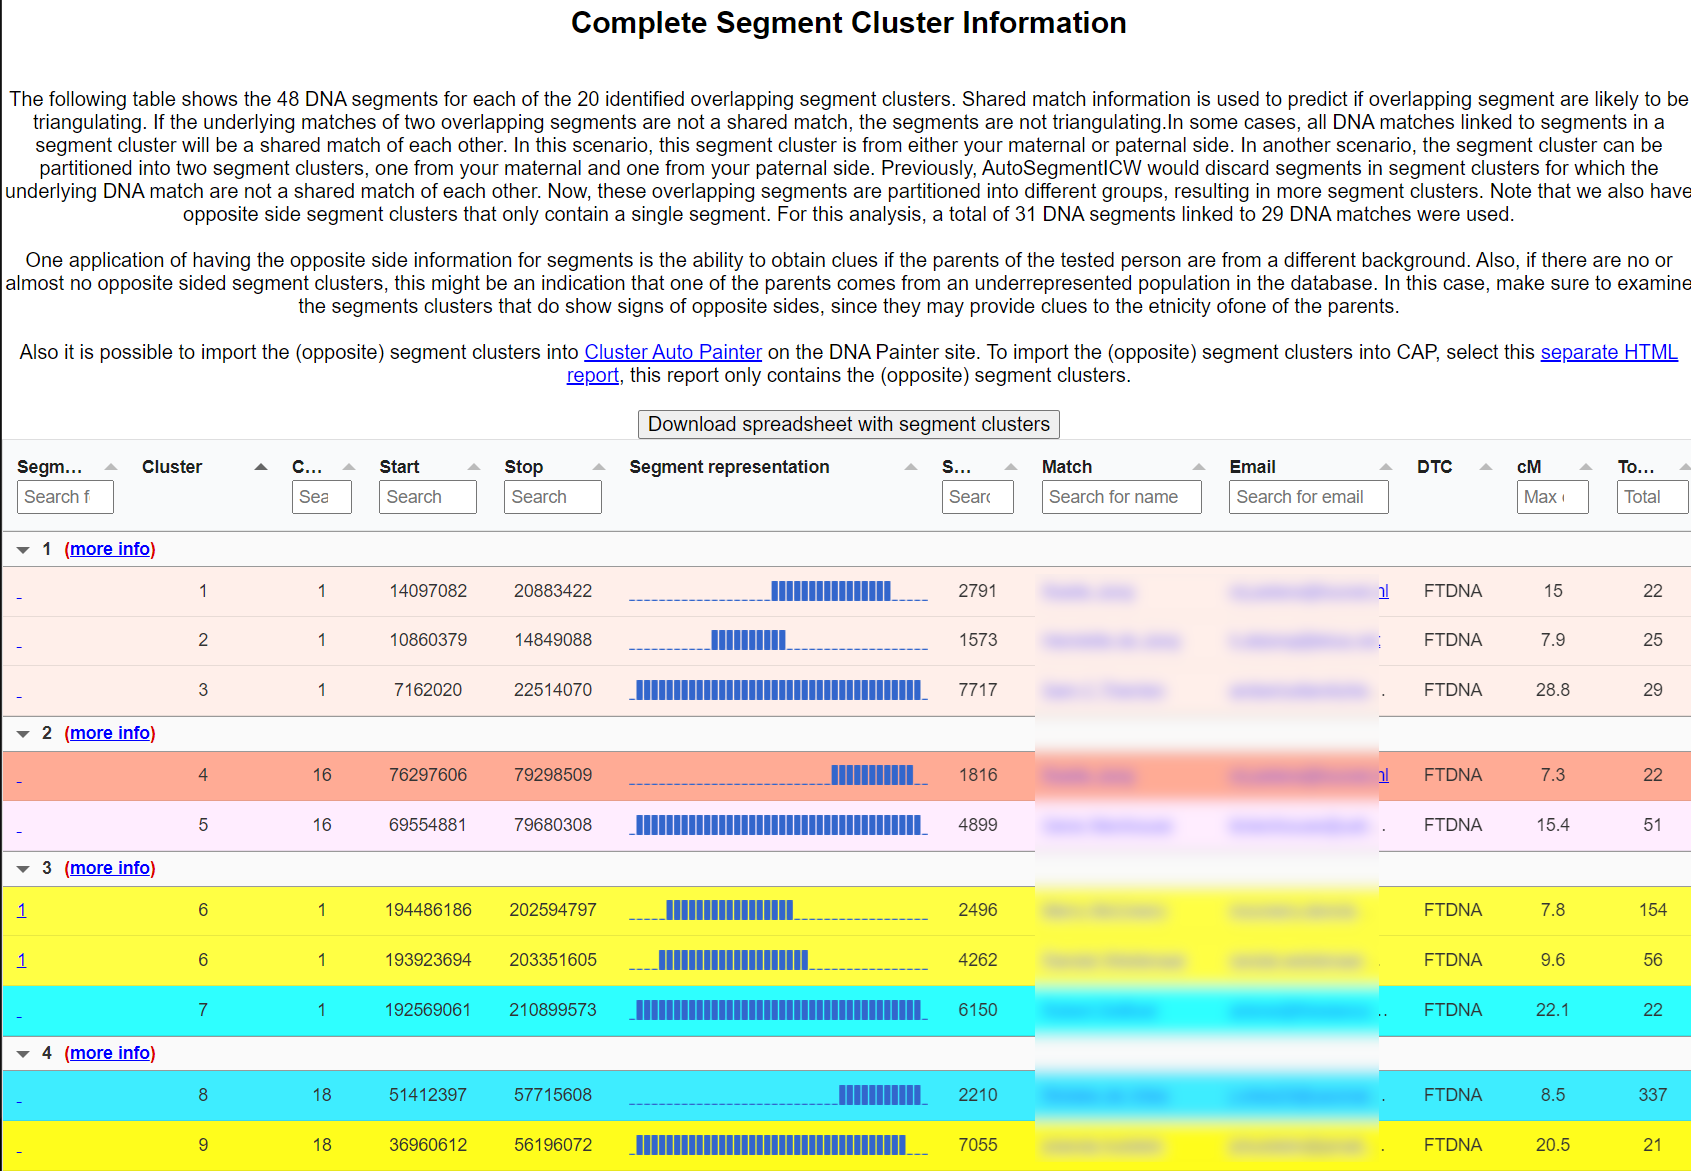
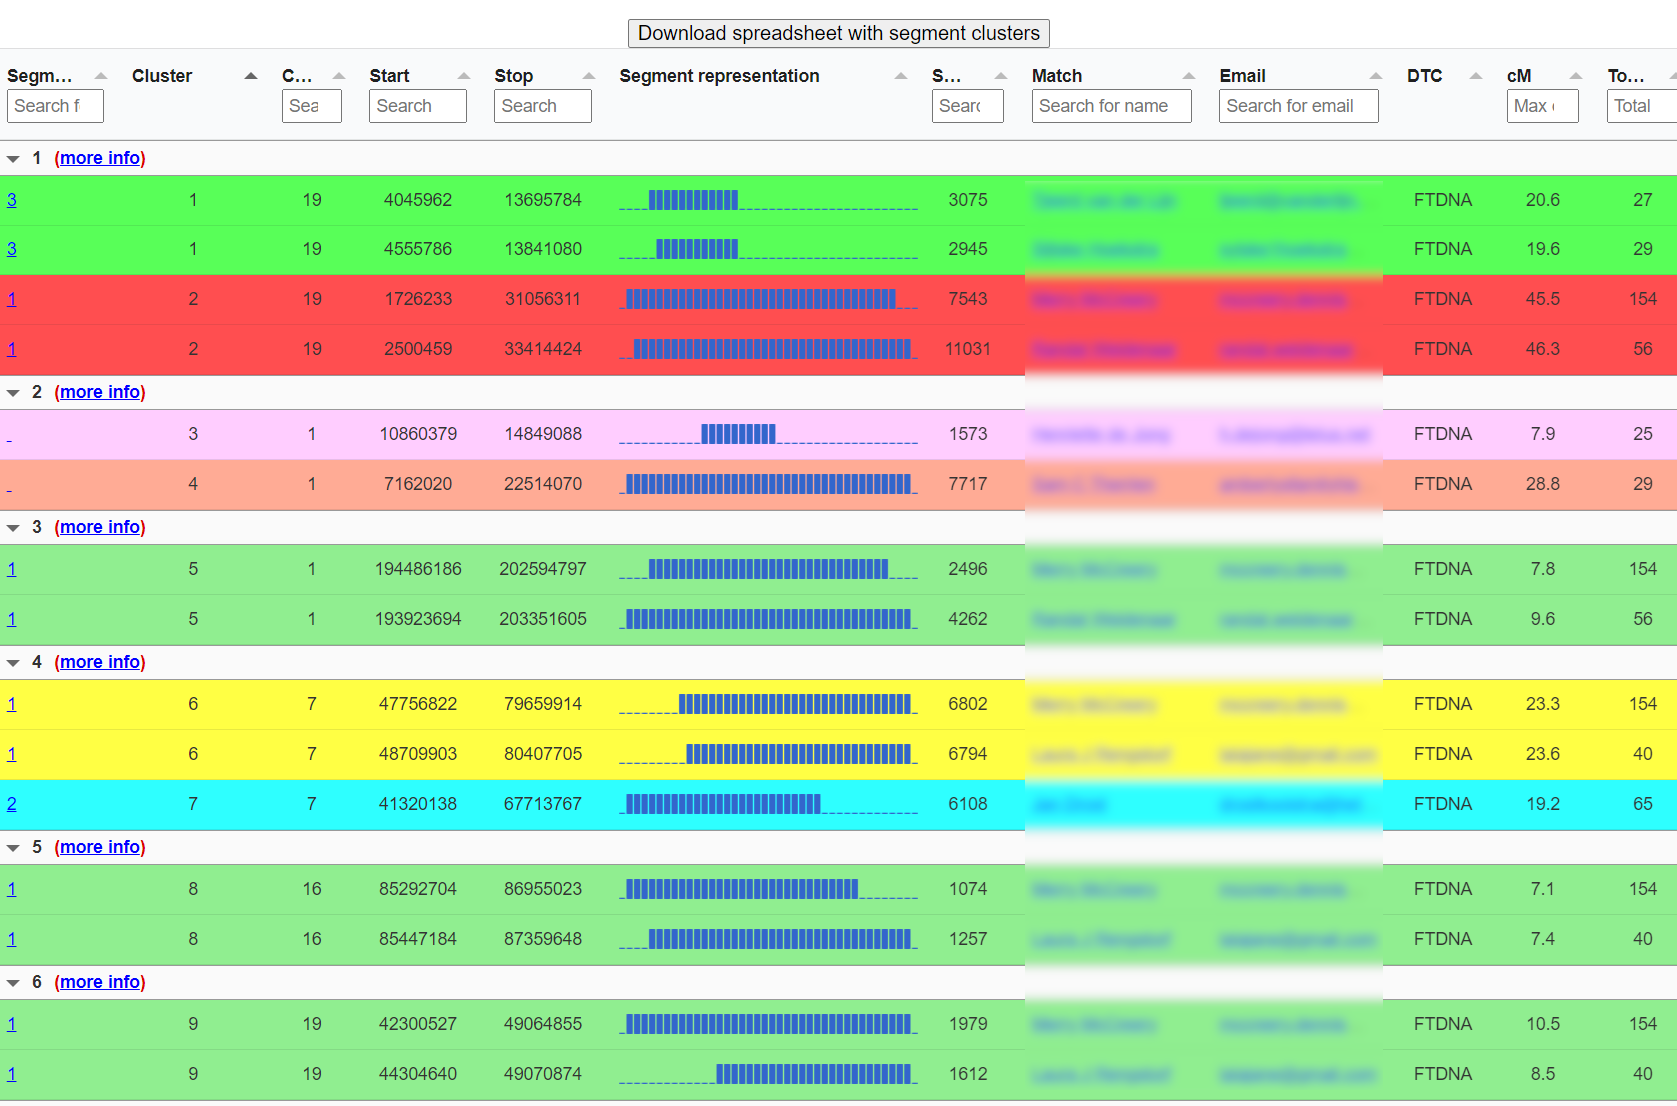
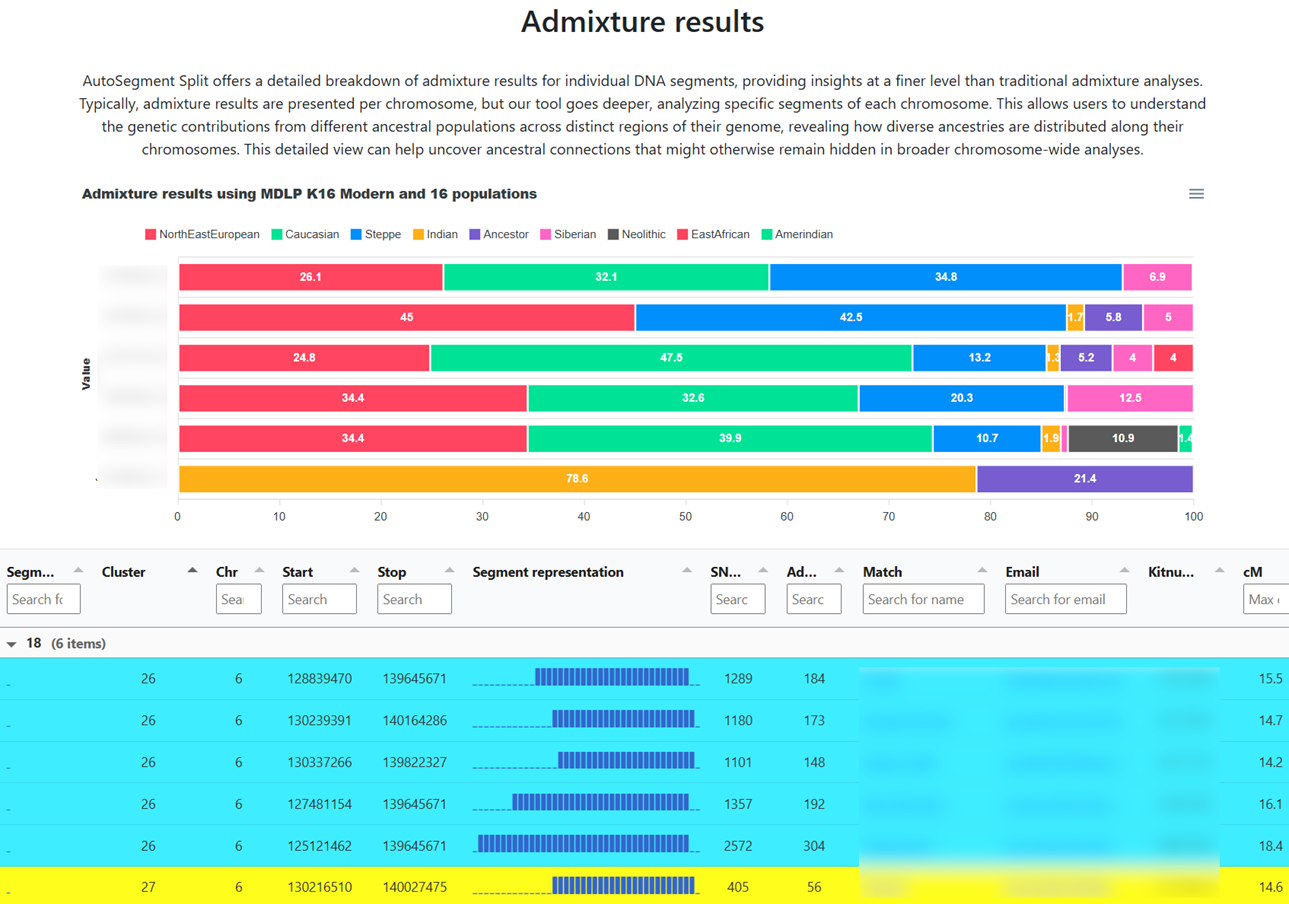
Opposite-sides detection & AutoSegment Split
When overlapping segments do not share ICW/triangulation status, the matches likely descend from opposite parental sides. AutoSegment flags this inside each cluster. On GEDmatch, AutoSegment Split takes this further with admixture bars per segment, especially useful for adoptees or for testers with one parent from an under-represented population.
Output
- Main HTML cluster chart and Excel spreadsheet.
- Per-cluster chromosome pages showing the overlap region.
-
pileup_report.htmlin thechromosomesfolder, your personal pile-up visualization. - Segment files formatted for import into DNA Painter.
Tips
- Start with 10 cM minimum overlap; lower values add noise quickly.
- Don't treat a non-GEDmatch cluster as a triangulated group. Treat it as "probably same ancestral segment."
-
If the HTML chart is too big, use the Excel file or the tables-only
_chart.html.
AutoKinship
What it does
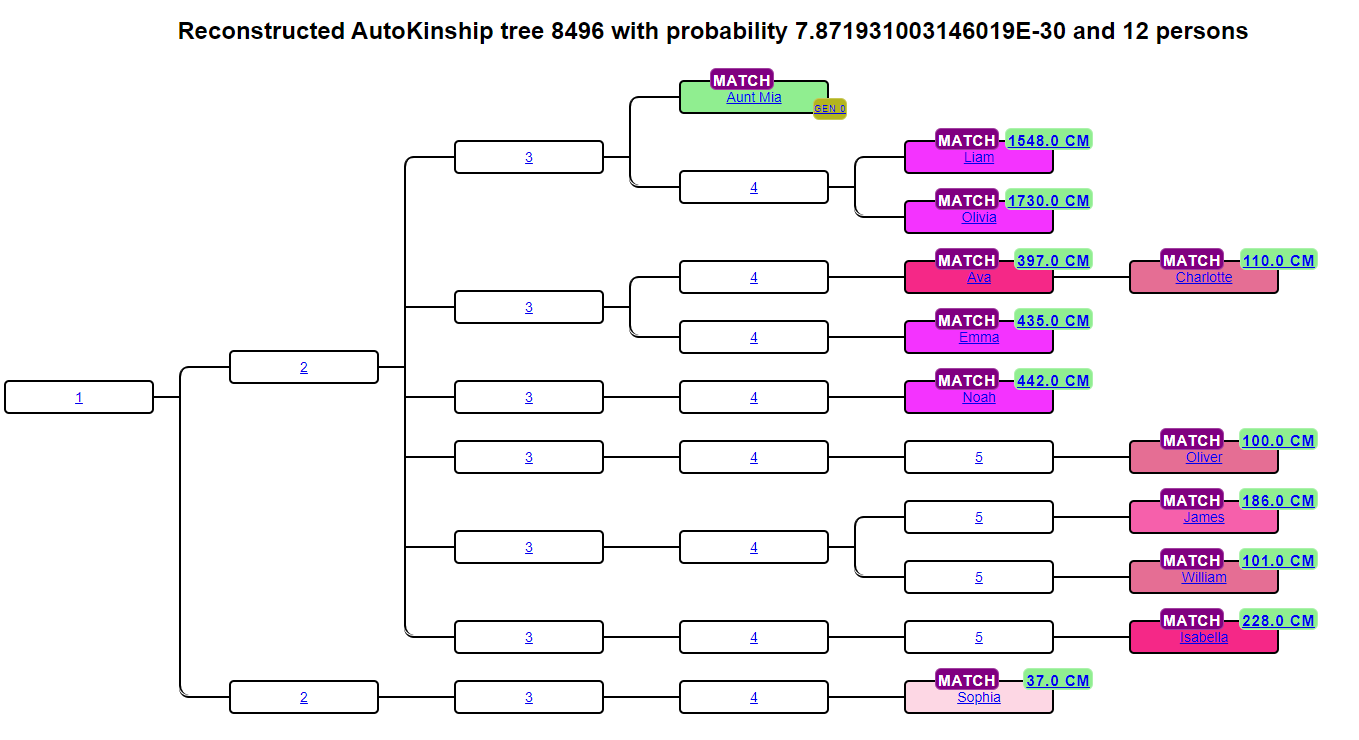
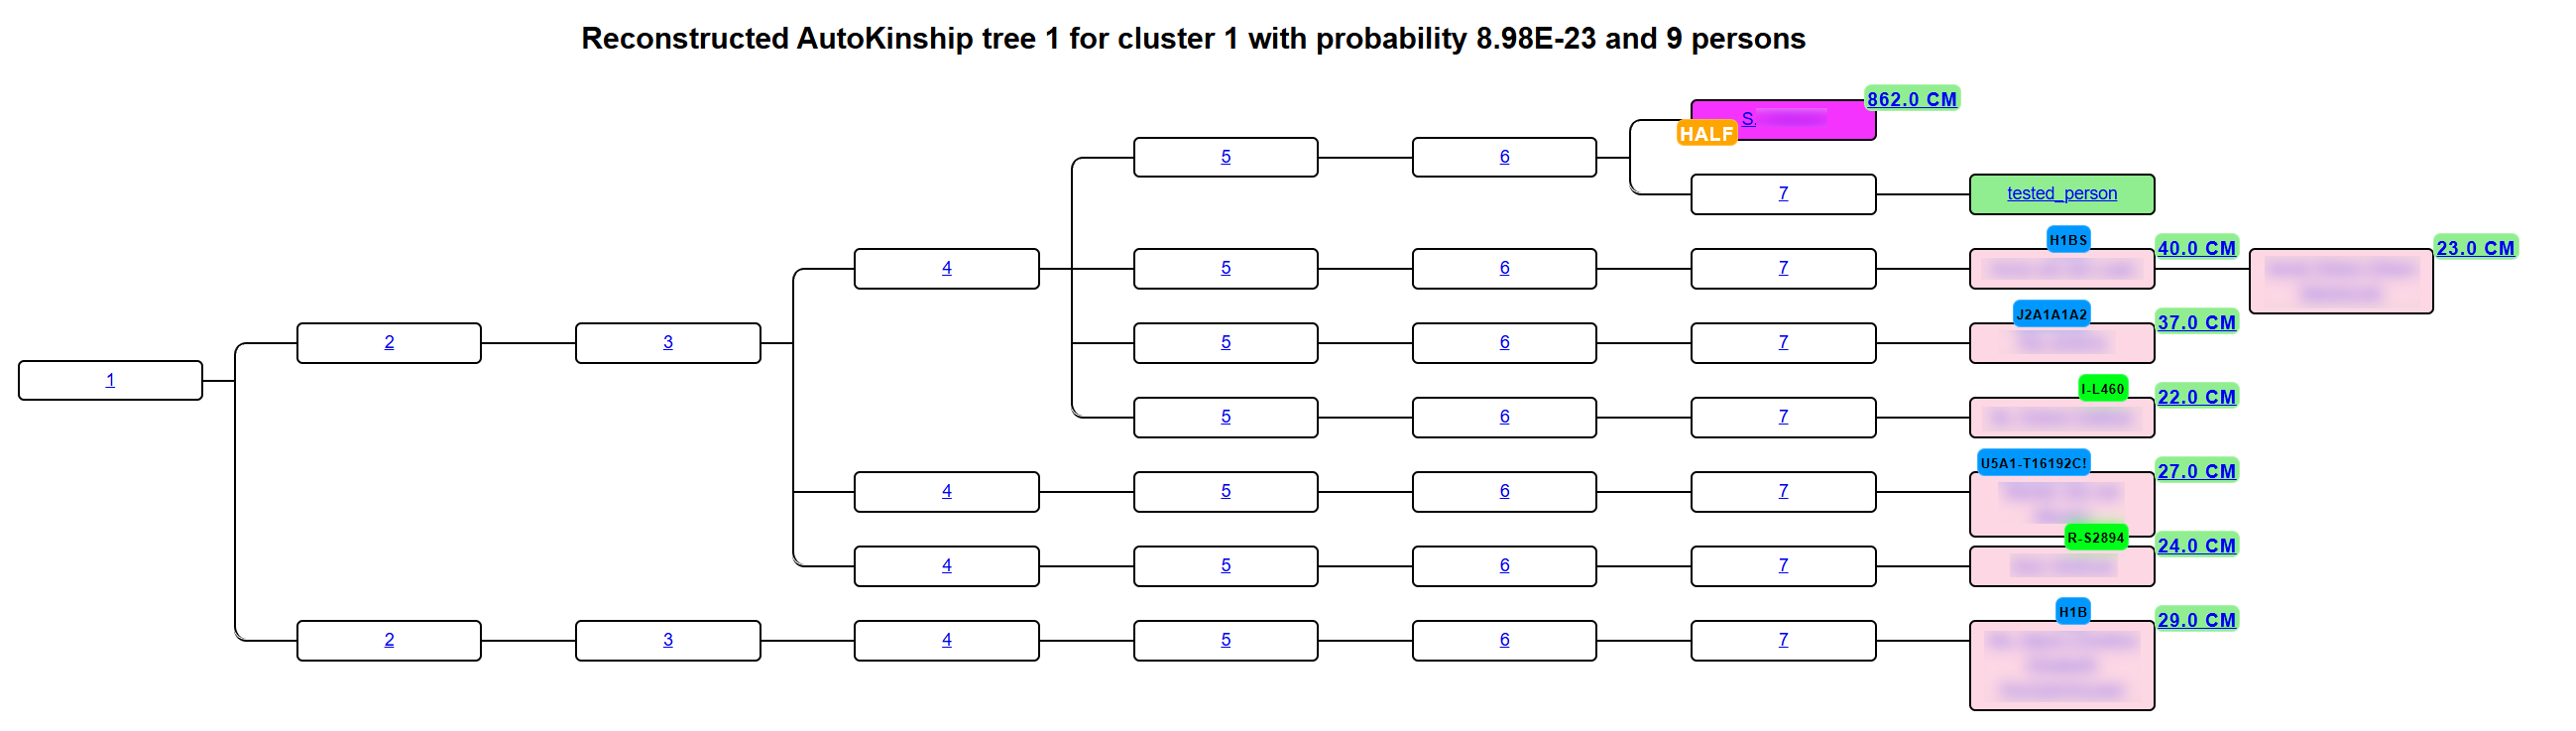
AutoKinship predicts family trees from DNA evidence alone. It does not need you or your matches to have trees. Using shared-cM amounts between you and every pair of matches, it infers relationship pathways and draws them as an interactive kinship chart.

Where it runs
- FamilyTreeDNA: fully automated on the members site (flagship integration).
- GEDmatch: integrated as a Tier 1 tool.
- Not available for Ancestry (removed 2020) or 23andMe (no automated retrieval).
Step-by-step (FTDNA)
- From your Profiles page, click Start analysis and select AutoKinship.
- Set thresholds: min/max shared cM, minimum largest segment, and minimum cluster size. Start conservatively.
- Choose match selection, "top matches within the selected range" is a solid first-run default.
- Enter your FTDNA password and your 2FA code if enabled.
- Review the credit cost and click Perform analysis. The ZIP arrives via email and can also be downloaded from the notifications panel in the top right of the site. Save and unzip the report.
What's inside
- AutoCluster HTML chart with a display dropdown (cM values, or P/M icons if you've bucketed).
- Per-cluster AutoKinship sections with reconstructed predicted trees and alternative hypotheses.
- AutoTree section when tree data exists.
gephifolder, the bridge to AutoLineage.-
matchesfolder with one HTML per DNA match including any attached tree info.
Understanding the predictions
AutoKinship doesn't see birth dates, so generational placement can be off (an "uncle" might really be a 2C1R). The structure of the tree, who links to whom, is usually right. Use AutoLineage afterwards to feed in known relationships and pin generations.
Tips
- Clusters with small mutual cM point to distant MRCAs; predictions are inherently fuzzier. Focus first on strong-cM clusters.
- Turn on Family Matching at FTDNA first, the P/M overlay dramatically improves chart readability.
- Invite matches on other sites to upload to FTDNA (it's free). A bigger FTDNA match pool means a better kinship result.
- Free-tier credits cover an AutoKinship run, try it before subscribing.
Common ancestors background
This chapter is a long-form companion to the AutoTree and AutoKinship tool pages. It explains how Genetic Affairs finds common ancestors, the algorithms, the history behind them, and how the approach has evolved between 2018 and 2026. If you want to run the tools, the AutoTree and AutoKinship tabs cover the step-by-step instructions. If you want to understand what happens inside the box, and why the standalone tools work the way they do but AutoLineage exists the way it does, read on.
The short version. The standalone AutoTree and AutoKinship tools are automated, opinionated pipelines with fixed internal parameters, they don't expose knobs for name-matching strictness, birth-year tolerance, clustering weights, or external tree sources. Everything is tuned for "press the button and get a report." AutoLineage was built as the workbench successor: the same algorithms, but with every parameter exposed, plus the ability to import your own GEDCOMs, One2Tree saves, WikiTree matches and trees downloaded for all matches at GEDmatch. The automated tools remain the fastest way to get a first look; AutoLineage is where you refine.
The common-ancestor problem, in plain language
When you open a list of DNA matches, every stranger on that list shares DNA with you because, at some point in the past, you share a most recent common ancestor (MRCA) or an ancestral couple. The genealogical question is: which ancestor? Answering it by hand means chasing each match's attached tree back generation by generation, matching names and places between trees, and trying to decide whether two "John Smith b. ~1820" entries refer to the same man.
Doing that across hundreds of matches is impossible in any reasonable amount of time. Automating it is hard for three interlocking reasons:
- Names are fuzzy. Johan, Jan and John may be the same person. van der Meer, Vandermeer and Vermeer may or may not be the same surname. Pre-1811 Frisians used patronymics rather than fixed surnames; pre-fixed-surname Norwegians used farm names, so one woman might appear as A. Skjold in one tree and A. Halvorsdtr skjold in another.
- Dates and places are patchy. Some trees give a full birth date; others give only a decade or nothing at all. A match's 3× great-grandmother may appear in four different trees with four slightly different birth years.
- Trees are incomplete. The true common ancestor may not appear in every tree, only some descendants reached back far enough. The algorithm has to reconstruct the MRCA from partial evidence.
AutoTree's answer is a three-step clustering pipeline that we'll look at in detail below. AutoKinship sidesteps the problem entirely, it reconstructs the tree from the amount of DNA each pair of matches shares with each other, using no genealogy at all.
Timeline of common-ancestor discovery at Genetic Affairs
The Genetic Affairs tools did not arrive in one release. Each tool addressed a different piece of the common-ancestor problem, and each built on what came before.
| Date | Milestone |
|---|---|
| Late 2018 | AutoCluster launches. No tree integration yet, it groups matches by shared-match relationships only. Establishes the visual paradigm (diagonal cluster chart) that everything else builds on. |
| Feb 2019 | MyHeritage licenses AutoCluster and integrates it natively, exposing the method to millions of testers. |
| Dec 2019 | AutoTree launches. First release of the three-step surname → first-name → date clustering to identify common ancestors inside the trees of each cluster's matches. ZIP output includes GEDCOM exports of every reconstructed tree. |
| May 2020 | AutoPedigree launches, AutoTree output is used to synthetically generate descendants and rank candidate positions where an unknown tester might fit inside a candidate tree, scoring each position against the shared cM between the tester and the matches. |
| May 2020 | Ancestry issues a cease-and-desist. Automated retrieval of Ancestry matches, trees and ThruLines data stops on 1 June 2020. The block has never been lifted. |
| Apr 2021 | GEDmatch (Verogen / QIAGEN) licenses AutoCluster, AutoTree and AutoPedigree as part of Tier 1. |
| Oct 2021 | AutoKinship launches. First tool to reconstruct genetic family trees from shared-cM amounts alone, no trees required from tester or matches. Initially automated only for 23andMe, because only 23andMe (at the time) exposed inter-match cM. |
| Feb 2022 | AutoKinship is added to GEDmatch Tier 1. The GEDmatch implementation uses true triangulation data and fully-identical-region (FIR) data to discriminate full siblings from half siblings, an accuracy boost unique to GEDmatch. |
| Mar 2024 | AutoLineage launches. Rebuilds AutoTree and AutoKinship as interactive modules inside a browser workbench, with user-adjustable parameters, external GEDCOM import, and cross-company match pools. This is the first Genetic Affairs product where users can tune the algorithms themselves. |
| ~2025 | FTDNA's Matrix upgrade exposes match-to-match cM, enabling automated AutoKinship for FTDNA for the first time. |
| Feb 2026 | Modern workflow consolidates: automated FTDNA AutoKinship + AutoTree first, then AutoLineage for refinement with GEDCOMs, WikiTree imports, and known-relationship pinning. |
How AutoTree identifies common ancestors: the three-step algorithm
AutoTree operates per cluster. Inside one cluster of shared matches, it pools every person who appears in any attached tree, a single cluster of ten matches might pool 3,000–15,000 tree persons, and then searches that pool for MRCAs using three consecutive network-clustering passes. The same common-ancestor identification is also performed across all trees from all clusters combined, so an MRCA can be found between matches that sit in different clusters.
Step 1: Surname similarity network
AutoTree collects every surname appearing in every tree across the cluster and builds a network where each surname is a node and edges link surnames that look alike. A network-clustering algorithm then groups similar surnames into surname clusters, so that Smith, Smyth and Smithe end up together even when two match trees spell the same ancestral surname differently.
Step 2: First-name clustering within each surname group
Within each surname cluster from Step 1, a second similarity network clusters first names. This is how AutoTree decides whether "Johan Smit" in tree A and "Jan Smit" in tree B are the same man. The same caveats about locale-specific name behaviour apply here too.
Step 3: Birth/death year disambiguation
The third pass splits first-name clusters by birth and death year with a fixed tolerance. Two different John Smiths born forty years apart remain distinct; two John Smiths born two years apart are treated as the same person. The year tolerance is not exposed in the standalone tool, AutoLineage's equivalent exposes it with a default of ±2 years.
From identified persons to MRCAs
Once the three passes have identified a set of "canonical" tree persons that appear in two or more match trees, AutoTree walks each match's tree upward from those persons and flags ancestor pairs (or single ancestors) that serve as the MRCA for two or more matches in the cluster. These become the cluster's common-ancestor candidates. A final pass extends the search across cluster boundaries, if the same MRCA turns up in three different clusters, that's a strong signal the clusters share a branch.
Common locations as a second signal
In parallel with the ancestor search, AutoTree runs a location analysis: birth, marriage and death places from all match trees are geocoded and clustered using distance thresholds. When several matches in a cluster have tree persons who were born within a small radius of each other, think one rural Dutch parish, or a single Friesian village, that geographic concentration is an independent line of evidence for a shared ancestral line. Location clusters are reported alongside ancestor clusters in the output.
How AutoKinship reconstructs trees from DNA alone
AutoKinship asks a different question from AutoTree. AutoTree asks "what MRCA explains why these people appear in each other's trees?"; AutoKinship asks "what tree topology best explains the amount of DNA these people share with each other, even if no trees exist?" It needs genealogy from no one. It only needs the cM matrix.
The input: a full inter-match cM matrix
For each cluster, AutoKinship reads the shared-cM between the tester and every cluster member and between every pair of cluster members. That second number, how much DNA your matches share with each other: is the critical one. Without it, you only know that matches A, B and C belong together; with it, you know that A and B share 220 cM while B and C share only 38 cM, which is enough evidence to say A and B are close cousins and C is a more distant relative on the same line.
The probability engine
The core statistical backbone is Brit Nicholson's simulated shared-cM distributions, published in April 2021, 500,000 simulated pairs per relationship type, producing a probability distribution of shared-cM for every relationship from parent-child out to distant cousins. AutoKinship layers vendor-specific probability tables on top (MyHeritage, 23andMe, GEDmatch each have their own measurement biases).
Tree enumeration and ranking
For each cluster, AutoKinship generates candidate tree topologies that could plausibly produce the observed cM pattern. For each candidate tree it multiplies the probability of every observed cM value (both tester-to-match and match-to-match) under that tree, the product is the tree's combined likelihood. Trees are ranked by likelihood and roughly the top ten are returned, each with a ratio showing how much more likely it is than the next-lower-ranked tree.
Known failure modes
AutoKinship's weakness is the opposite of AutoTree's: it has perfect cM evidence but no birth-year evidence, so it cannot tell you which generation a person belongs to. Matches are frequently placed at the wrong generational level, the structure of the tree (who links to whom) is usually right, but the vertical placement can be off by a generation. In a cluster dominated by 1C2Rs, for example, the tool may rank trees that place the true 1C2Rs as 2C or 2C1R, because the cM values are also consistent with the shallower interpretation.
Other practical limits:
- Cluster size. The server has a fixed ten-minute processing cap per cluster. Very large clusters can time out and return no result.
- Full- vs half-sibling ambiguity. Shared cM alone cannot always distinguish full from half siblings. GEDmatch's AutoKinship integration solves this with fully-identical-region (FIR) data, unavailable on other vendors.
- Endogamy. In endogamous populations (Ashkenazi Jewish, Acadian, Polynesian, etc.), shared cM values are inflated across the board and the probability model breaks down. The Genetic Affairs manual itself recommends alternative tools for endogamous research.
- Ancestry has no automated path. Ancestry exposes neither segment data nor match-to-match cM, so AutoKinship cannot be automated for Ancestry kits. Since late 2024 the workaround has been Ancestry Pro Tools → AutoLineage → manual AutoKinship.
AutoPedigree
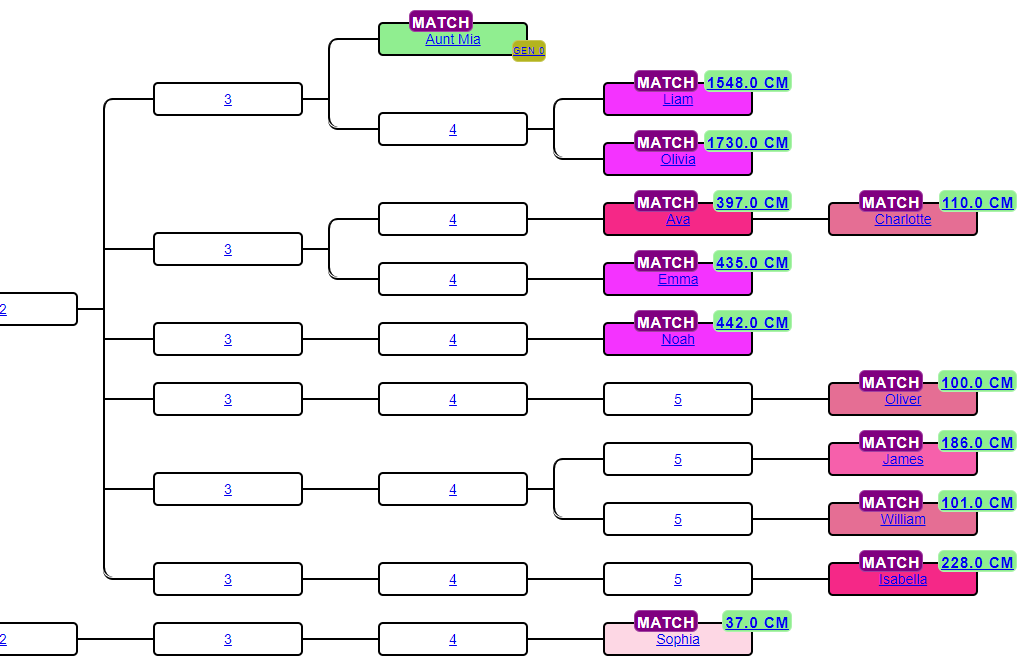
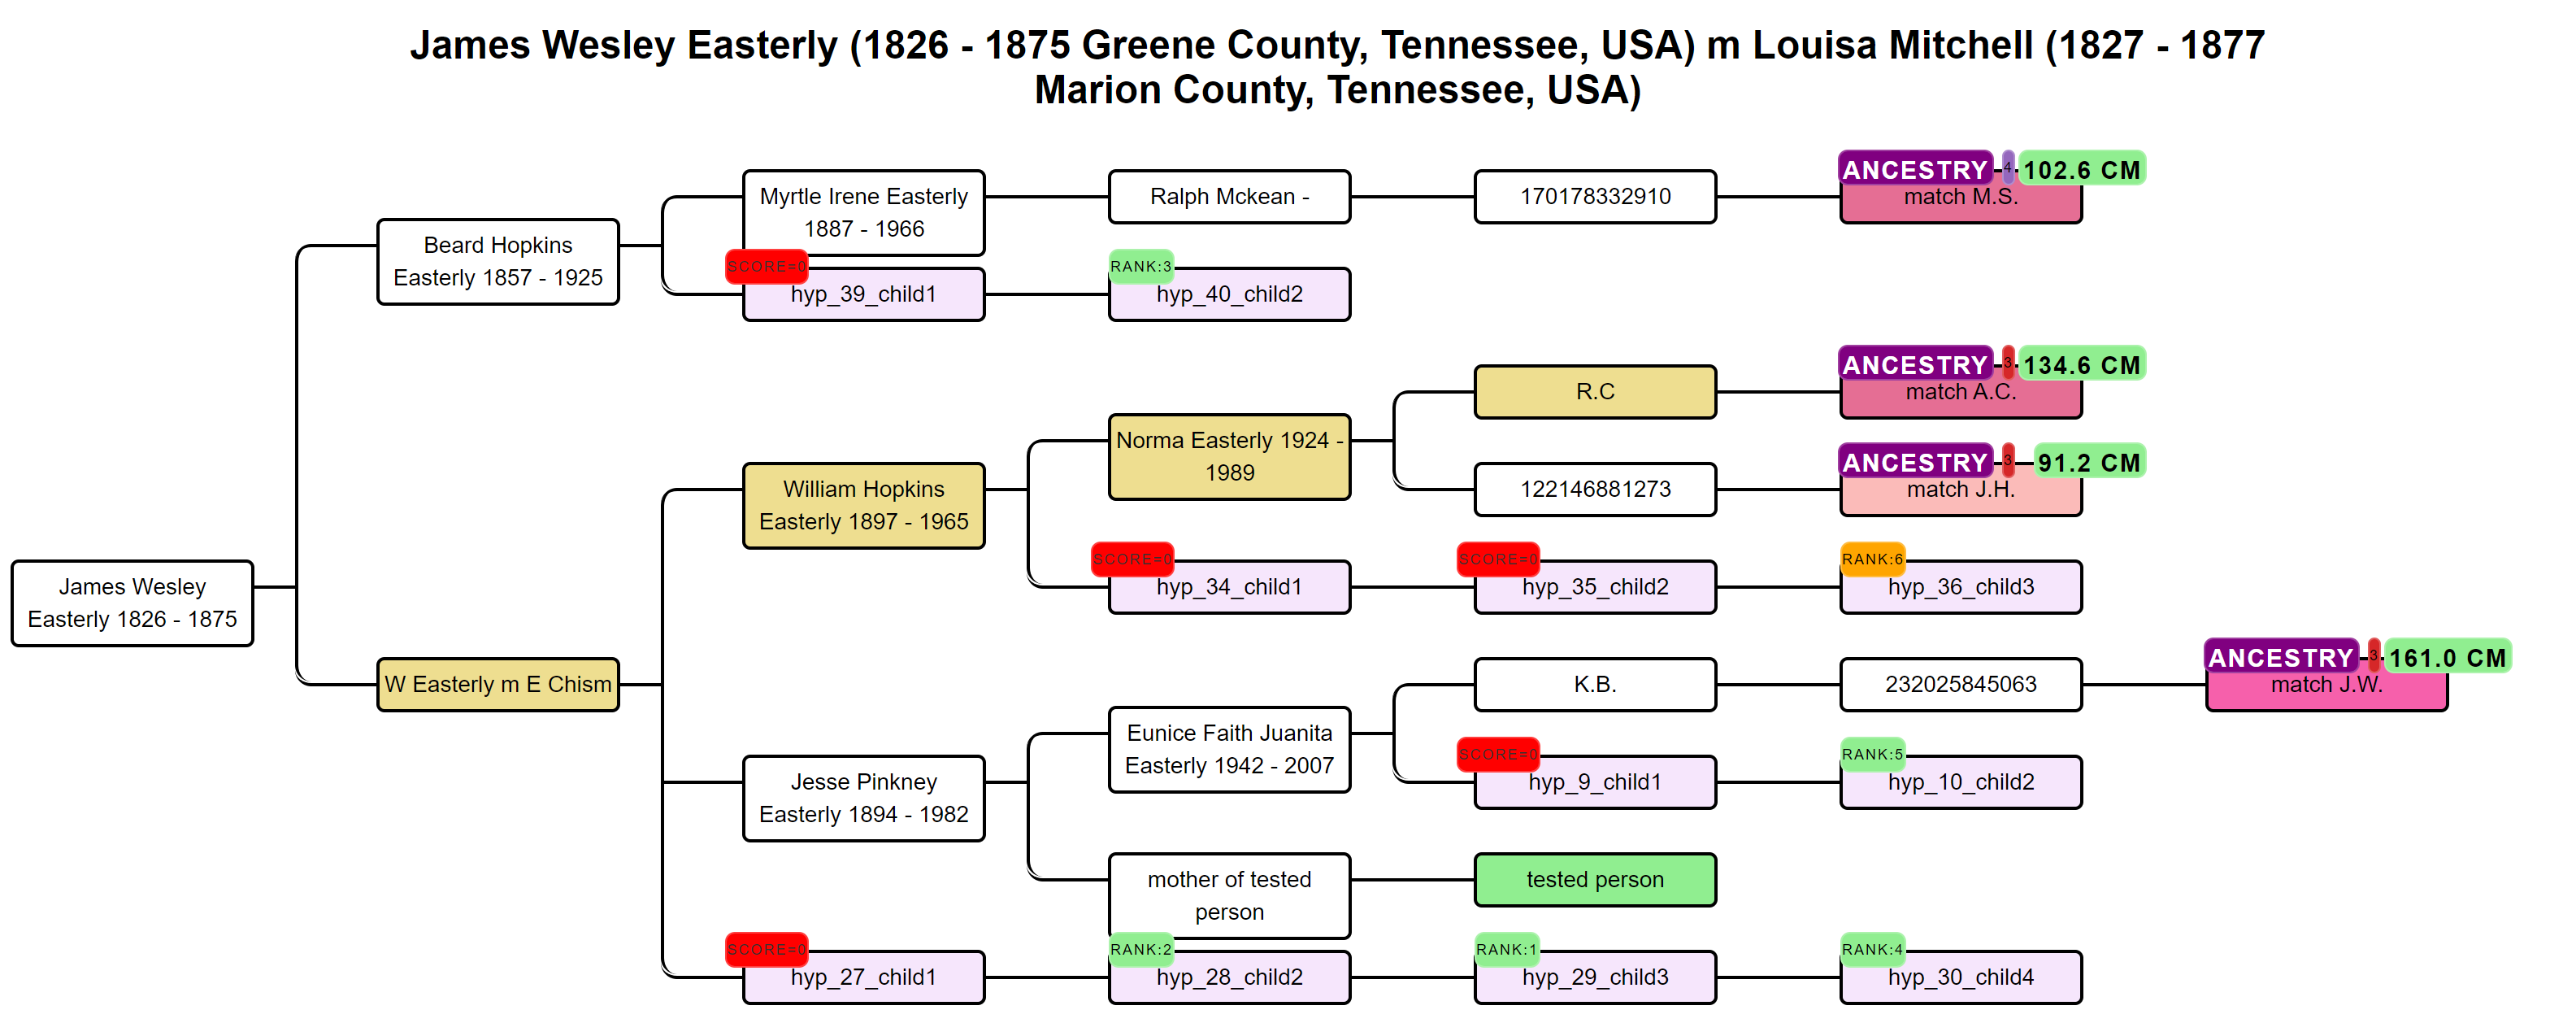
AutoPedigree (May 2020) takes AutoTree's MRCA output and uses it to generate candidate positions where an unknown tester might fit inside a reconstructed tree. For each MRCA couple supported by enough matches (default: three matches at 30–40 cM or more sharing a common-ancestor tree), AutoPedigree synthetically generates descendants and ranks each candidate position by multiplying the Shared cM Project probability of each match's observed cM against the hypothesis, the resulting combined odds-ratio ranks the candidates, with badges marking the top five (green), other viable candidates (orange) and impossible positions (red).
Why AutoLineage was built: a configurable workbench
AutoLineage (March 2024) is the successor design. Rather than add knobs to the legacy standalone tools, the algorithms were rebuilt as modules inside a browser workbench where every parameter is exposed and, critically, where the match pool itself can be augmented with external data. The same AutoTree three-step pipeline and the same AutoKinship probability engine run under the hood, but you now decide how they run.
External trees: the biggest difference
In a standalone AutoTree run, the tool reads only the trees attached to your matches inside that single vendor. If your FTDNA matches don't have trees, the MRCA search has nothing to work with. AutoLineage lifts this ceiling in five directions:
- Your own GEDCOMs. Export a tree from any desktop program, Family Historian, Legacy, RootsMagic, Gramps, the Mac's MacFamilyTree, and import it. That tree now participates in the MRCA search.
- One2Tree saves. The One2Tree browser extension turns any Ancestry or MyHeritage tree into a portable GEDCOM. Trees saved this way can be imported individually or in batches, dramatically enlarging the pool of trees AutoLineage can search, especially valuable for Ancestry matches, where automated tree retrieval has been blocked since 2020.
- All-matches tree download at GEDmatch. GEDmatch lets Tier 1 users download the GEDCOMs uploaded by all their DNA matches in a single operation. AutoLineage can ingest the whole batch, so one import populates hundreds of trees at once.
- WikiTree. When a match has a WikiTree profile, you can pull the relevant subtree and link it in AutoLineage. This is the only Genetic Affairs context where WikiTree data participates in MRCA discovery.
- Trees attached at any supported vendor. FTDNA match trees, MyHeritage match trees, 23andMe match trees (legacy data), Ancestry trees via Pro Tools or Copy-Paste Wizard, all can sit inside one AutoLineage profile and feed a single MRCA pass.
Exposed parameters: finally
AutoLineage's Find Common Ancestors dialog exposes what the standalone tool hides: name-matching strictness, year tolerance (default ±2 years), location distance thresholds, and the specific person fields to compare on. You can run several passes with different settings and compare the resulting MRCA lists side-by-side. The AutoKinship wizard inside AutoLineage exposes max generations, trees per iteration, final trees to keep, and, most importantly, checkboxes for Include known relationships and Include MRCA relationships, so documented genealogy and DNA evidence pin each other in one pass.
Known relationships: pinning what you already know
Before you run AutoKinship inside AutoLineage, you can mark relationships you already know for certain, this match is your first cousin, that match is a sibling of your mother, these two matches are brothers. The probability engine then treats those relationships as hard constraints and only enumerates trees consistent with them. Generational-direction pins solve the other half of the problem: tell AutoKinship which match is older than which, and the ambiguous-generation ranking problem largely goes away.
Vendor support for common-ancestor work, over time
The table below summarises how each vendor fit into the common-ancestor pipeline at each stage of the history. Read it top-to-bottom for a sense of how dramatically the picture has shifted in seven years.
| Era | FTDNA | MyHeritage | Ancestry | 23andMe | GEDmatch |
|---|---|---|---|---|---|
| 2019–2020 AutoTree era |
Automated | Licensed AutoCluster, AutoTree via GA site | Automated until June 2020 | No trees to parse | Before Tier 1 deal |
| 2021 AutoKinship launches |
AutoCluster/AutoTree automated; AutoKinship not yet (no inter-match cM) | AutoCluster native; AutoKinship manual entry | AutoKinship automated (first vendor) | AutoCluster/AutoTree Tier 1; AutoKinship not yet | |
| 2022–2023 GEDmatch Tier 1 |
AutoTree automated, AutoKinship still manual | Unchanged | AutoKinship automated | Full suite including AutoKinship with FIR / triangulation | |
| 2024 AutoLineage launches |
Full automated suite on GA site | Via AutoLineage import | Via AutoLineage Copy-Paste Wizard & Pro Tools | 23andMe security changes end automated retrieval | Full Tier 1; AutoKinship from GEDmatch feeds AutoLineage |
| 2025–2026 Current |
Fully automated, including AutoKinship after FTDNA Matrix upgrade | AutoLineage integration; legacy AutoClusters accepted | AutoLineage Copy-Paste Wizard | Legacy data only | Tier 1 remains the gold standard; drives exhaustive MRCA analysis up to 7 500 matches |
Practical conclusion: which tool when?
- Reach for standalone AutoTree or AutoKinship first when you want a fast, automated, unattended report, a zip that lands in your inbox and gives you clusters, MRCA candidates and reconstructed trees with one click. This is still the fastest way to orient yourself on a new kit.
- Switch to AutoLineage when the automated report raises more questions than it answers: when expected matches didn't converge on the MRCA you know exists, when a cluster looks messy, when you have external trees (your own GEDCOM, One2Tree saves, WikiTree profiles, GEDmatch all-matches batch) that could sharpen the picture, or when you want to pin known relationships and re-run AutoKinship with that extra evidence.
- For Ancestry data, AutoLineage is the only option. The 2020 cease-and-desist means standalone AutoTree and AutoKinship can't touch Ancestry, but via AutoLineage's Copy-Paste Wizard or shared-match save to HTML import (requires Pro Tools), full common-ancestor analysis on Ancestry matches is now possible.
- For GEDmatch, both paths work and are complementary. GEDmatch's Tier 1 AutoTree/AutoKinship is the easiest way to run on your GEDmatch match pool; AutoLineage is the place to merge GEDmatch data with other-vendor data for the same kit.
References for this chapter
The articles below are the ones cited or drawn on directly for this deep-dive chapter. Fuller blog archives are listed under the Help tab.
Algorithmic and conceptual
- AutoTree, official methodology page The primary source for the three-step clustering algorithm and the "no guarantee" disclaimer quoted in this chapter.
- AutoKinship, official overview Tool description, example reconstructed trees, and the statement that no genealogical trees are required from tester or matches.
- AutoKinship Tutorial PDF Contains the acknowledgement that matches are "quite often placed in the wrong generational level", the source for the generational-offset caveat in this chapter.
- A New Probability Calculator for Genetic Genealogy The simulated shared-cM distributions that power AutoKinship's probability engine, 500,000 pairs per relationship type.
Launch articles: how each tool was received
- AutoClustering by Genetic Affairs The first AutoCluster writeup, sets up everything that came later.
- Genetic Affairs Reconstructs Trees from Genetic Clusters, Even Without Your Tree or Common Ancestors The original AutoTree announcement and walkthrough. Especially strong on what AutoTree offers testers without their own tree.
- AutoPedigree Combines AutoTree with WATO The launch review of AutoPedigree, the tool that combines AutoTree's MRCA output with a statistical hypothesis engine to rank candidate positions for an unknown tester.
- New AutoKinship Tool Predicts Relationships and Builds Genetic Trees The launch article for AutoKinship, the one that introduced "predict trees from DNA alone, no genealogy required."
- Reconstruct trees for MyHeritage matches using AutoKinship The MyHeritage-flavoured AutoKinship walkthrough, two days after the general launch, shows the tool's first cross-vendor life.
- AutoKinship at GEDmatch by Genetic Affairs The GEDmatch integration of AutoKinship, the first version with full-vs-half sibling discrimination via FIR data.
- AutoKinship at GEDmatch A practical case study of the GEDmatch AutoKinship tool with notes on interpreting the generated trees.
Workbench era: AutoLineage & common ancestors at scale
- AutoLineage The introductory tour of AutoLineage, the moment the standalone algorithms became an interactive workbench.
- Pruning Your Trees in AutoLineage Keeping reconstructed trees tidy when a match has multiple trees, practical cleanup for Find Common Ancestors output.
- Convert Ancestry ProTools to Trees using AutoLineage and AutoKinship The article that restored Ancestry data to the common-ancestor pipeline after the 2020 cease-and-desist, via Ancestry Pro Tools imported into AutoLineage.
- Exhaustive MRCA Analysis for GEDmatch Matches MRCA analysis against up to 7,500 GEDmatch matches, the largest-scale common-ancestor search available anywhere.
- AutoKinship for MyHeritage and Ancestry: From Matches to Reconstructed Trees How AutoKinship inside AutoLineage now covers MyHeritage and Ancestry, closing the vendor gap left by the standalone tool.
- AutoKinship by Genetic Affairs Builds Family Trees from Your Matches at FamilyTreeDNA, and More The definitive 2026 end-to-end walkthrough, from FTDNA registration through automated AutoKinship into AutoLineage refinement.
AutoLineage: the flagship tool
AutoLineage is where everything comes together. It is the only Genetic Affairs tool that is genuinely cross-company, combine FTDNA, MyHeritage, Ancestry, 23andMe and GEDmatch data for the same tester in one profile, import trees from any source, cluster and re-cluster, detect common ancestors, and produce a refined, blended tree.
Prerequisites
- Genetic Affairs account.
- Active subscription for advanced AutoLineage features.
What AutoLineage is
AutoLineage uses advanced clustering to analyse your DNA matches and trees, helping you identify common ancestors across multiple DNA testing companies. It's particularly strong at three things:
- Organising matches: cluster by shared matches, re-cluster with different parameters, explore cluster-by-cluster rather than drowning in one giant list.
- Finding common ancestors: read the trees of your matches in bulk and search systematically for persons who appear in multiple trees.
- Reconstructing trees: blend AutoKinship's DNA-driven tree predictions with the documented MRCAs you identify.
How it differs from the other tools
AutoCluster, AutoTree and AutoKinship each do one thing automatically. AutoLineage is the workbench: you control parameters, iterate, and combine evidence. Advanced features require an active monthly subscription; the automated AutoKinship run that feeds AutoLineage runs on free credits.
What works with AutoLineage
| Company | Import options |
|---|---|
| Ancestry |
|
| FamilyTreeDNA |
|
| MyHeritage |
|
| 23andMe |
|
| GEDmatch |
|
| All vendors | AutoLineage backup files (matches and shared matches) |
The Copy-Paste Wizard
Added in late 2025, the Copy-Paste Wizard transformed the Ancestry workflow.
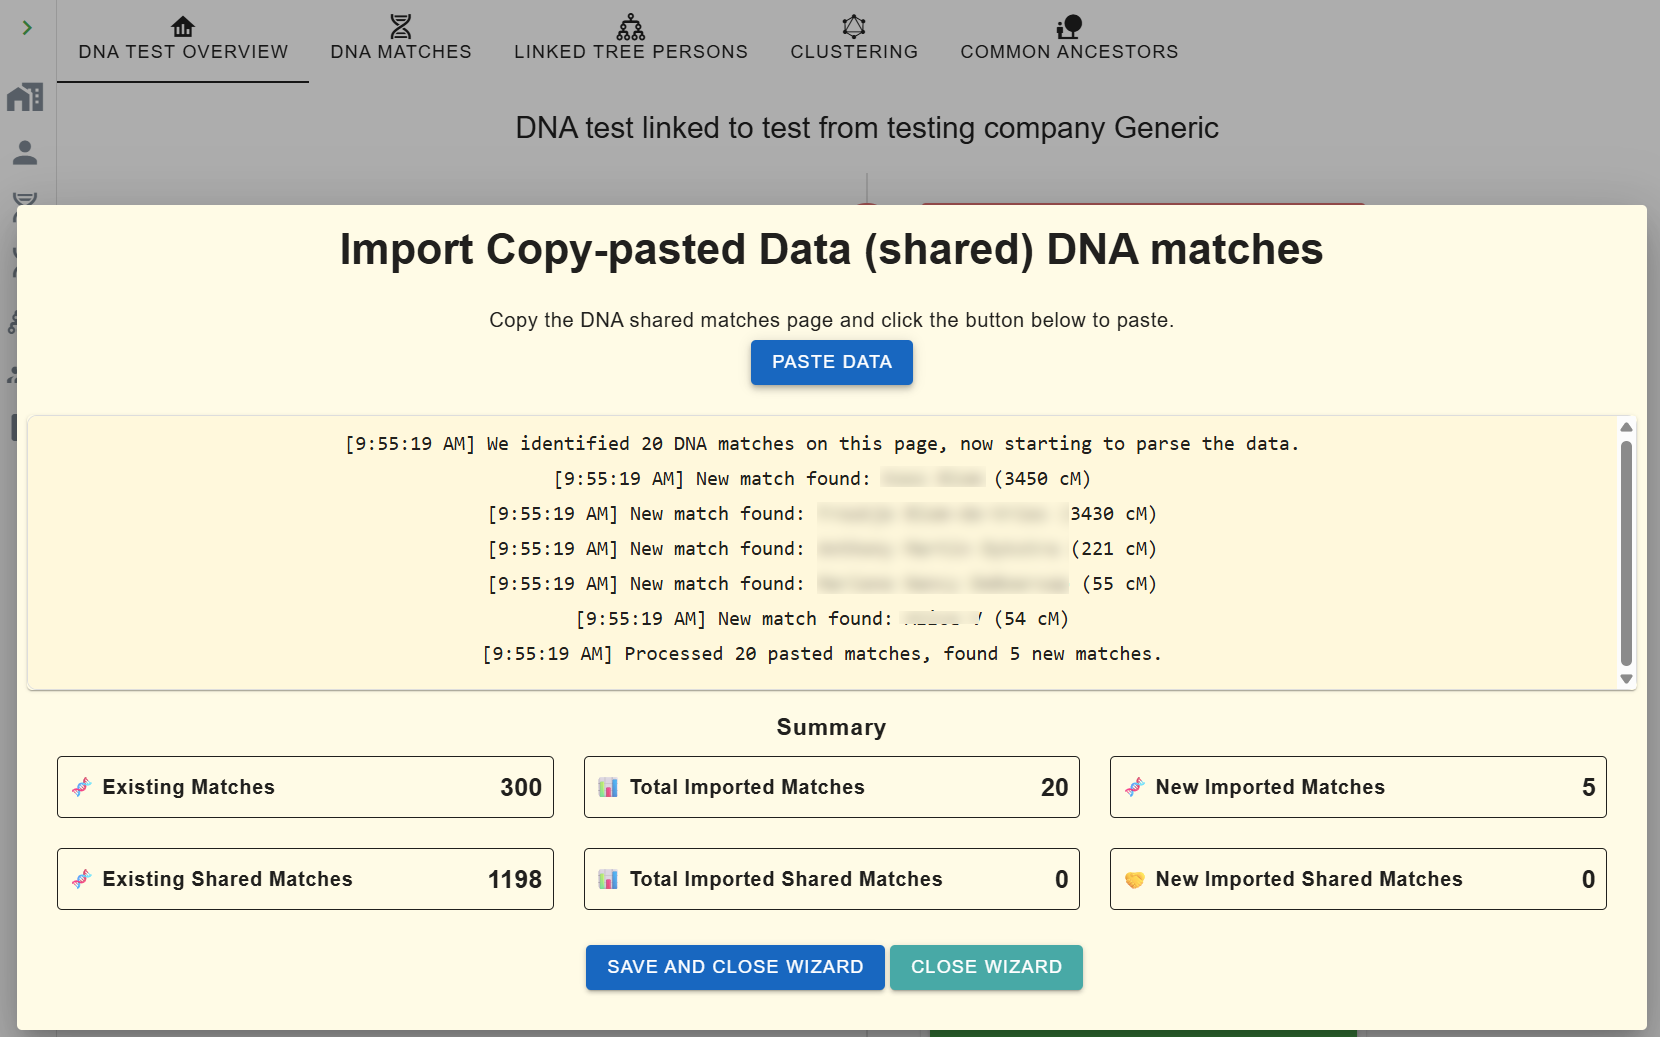
- Create a Generic DNA test under your AutoLineage profile.
- Under Import Matches, click Copy Paste Wizard.
-
Open your Ancestry match list in another tab. In the URL, change
ItemsPerPage=50toItemsPerPage=100to double capture per paste. - Ctrl-A / Cmd-A, copy, click the blue Paste Data button in the wizard and paste. Counters update live.
- Repeat for shared-match pages, the wizard auto-adds matches it hasn't seen, even low-cM ones.
- If nothing appears after pasting, re-select and copy from the very top of the source page, a quirk of Ancestry's layout occasionally hides the data.
The main workflow
Phase 1: Create Profile and register DNA test
- Open members.geneticaffairs.com/autolineage and click New Profile.
- From the profile, click Register DNA test. Choose the company (FTDNA, 23andMe, MyHeritage, Ancestry, GEDmatch, or Generic).
- Save. You arrive at the DNA Test Overview page. One profile can hold multiple DNA tests.
Phase 2: Import matches
-
Click Import Matches. Options (vary by company):
CSV, HTML, Copy-Paste Wizard, or FTDNA
nodes.csvfrom an AutoKinship report. - A dialog confirms how many matches were loaded.
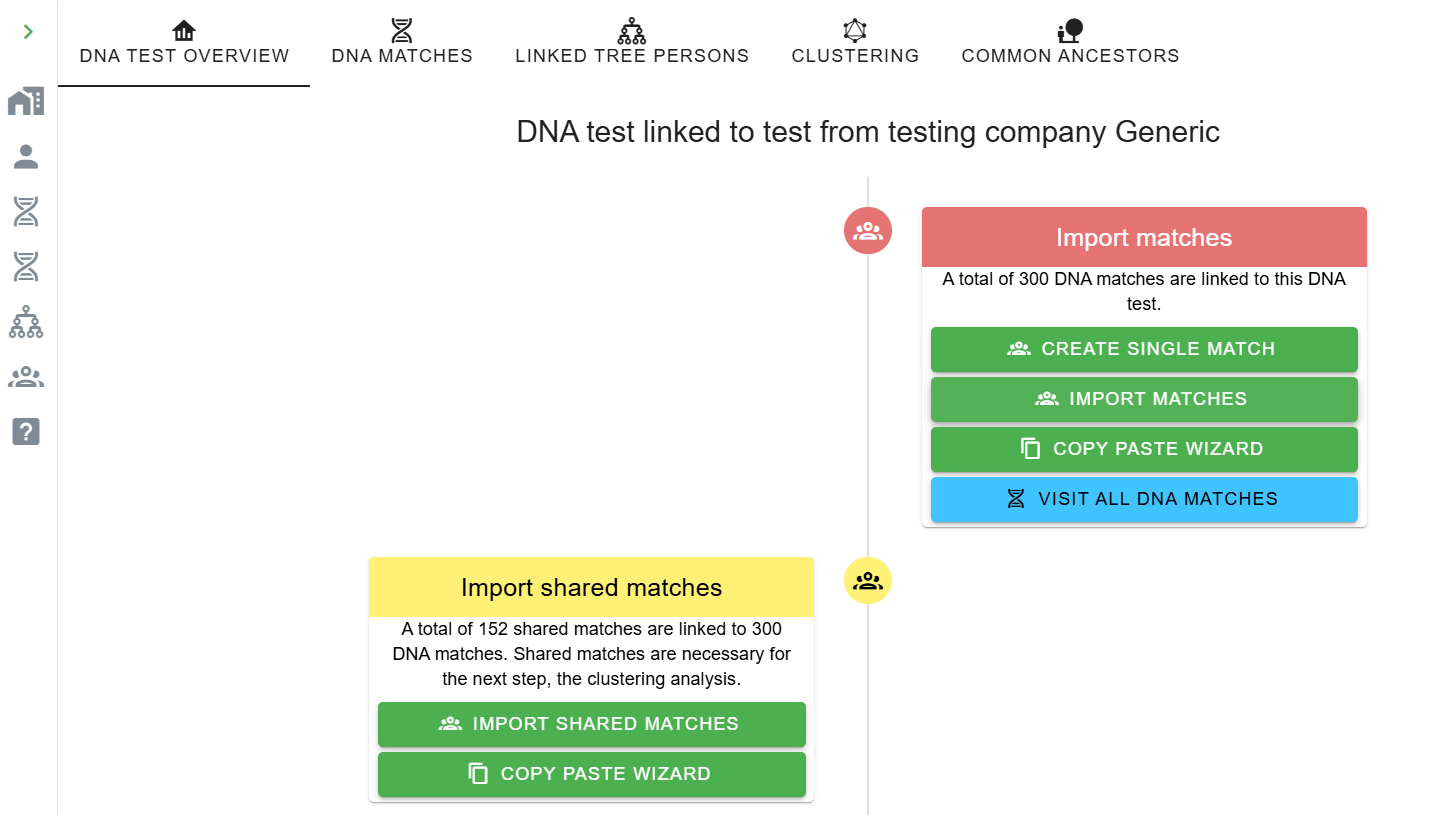
Phase 3: Import shared matches (ICW)
-
Click Import Shared Matches. MyHeritage:
AutoClusters HTML. FTDNA:
edges.csv. Ancestry/Generic: paste via Copy-Paste Wizard. - The ICW column fills in with shared-match counts.
Phase 4: Cluster
- Click Clustering. Set min/max cM, weighted vs. unweighted, inter-match shared-cM cutoff, cluster density, colour scheme.
- Click Start Clustering. The chart appears in AutoLineage.
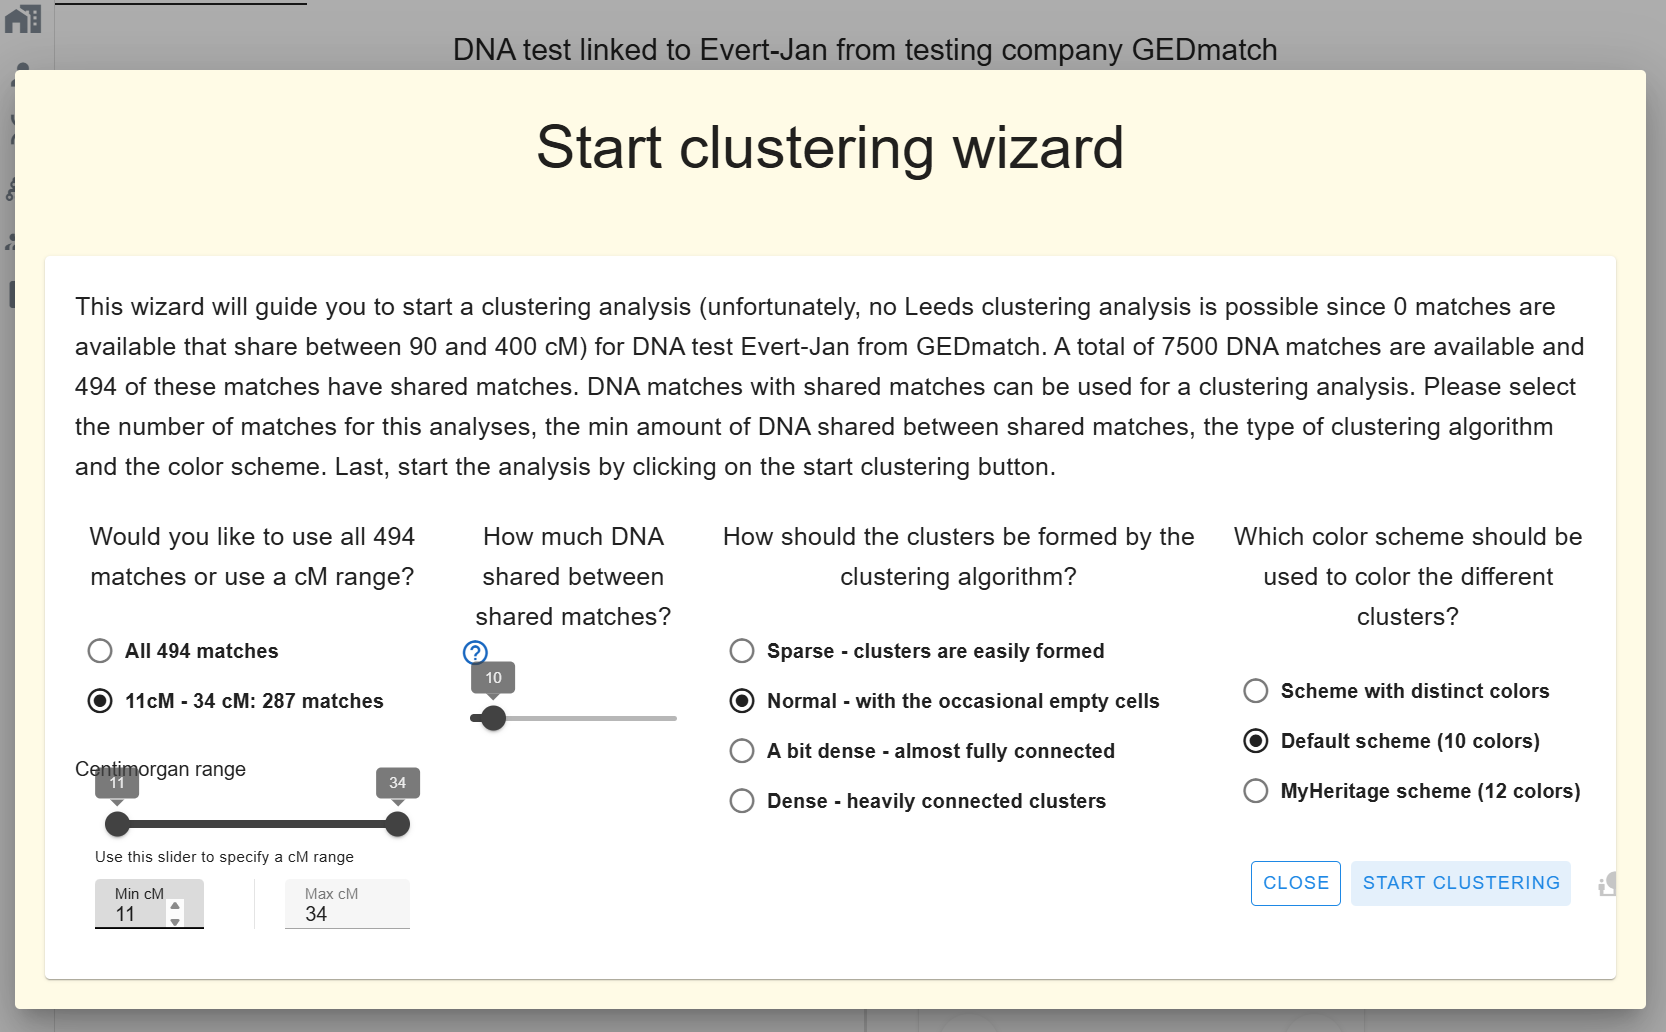
You can re-cluster instantly with different parameters without starting a new job. A huge orange cluster from the automated run may resolve into three coherent sub-clusters here.
Phase 5: Import trees
- Go to Tree Management → Import Trees and choose one or more of the import options below.
| Import option | Details |
|---|---|
| GEDCOM tree |
How to get a GEDCOMGEDCOM is a universally-accepted file format for family tree files. The One2Tree Chrome plugin allows users to download trees from matches of Ancestry, MyHeritage and FamilyTreeDNA. |
| GEDmatch GEDCOM tables saved as HTML (2 files) |
How to save the GEDmatch GEDCOM files
Navigate to the one-to-many-full and select 7500 matches.
Click on Search. Save the resulting page to your hard drive
(default file name:
|
| CSV file from DNA Gedcom |
How to export from DNA Gedcom
In DNA Gedcom, export the results for a profile. For the
tree file, select the CSV file that starts with
|
| Backup file from AutoLineage |
How to use an AutoLineage backupIn AutoLineage, create a backup of your tree and use this option to import those matches. |
| Backup file from AutoLineage (automated linking) |
How automated linking worksIn AutoLineage, create a backup of your tree that includes trees linked to DNA matches. When importing this file, matches with the same identifier will be automatically linked to the corresponding trees. |
| FTDNA HTML files in the matches folder |
How to import FTDNA match HTMLs
Run the AutoKinship analysis. Once finished, save the ZIP
file to your local drive and unzip it. Select all HTML files
in the |
| GEDmatch HTML files in the AutoKinship matches folder |
How to import GEDmatch AutoKinship match HTMLs
Run the AutoKinship analysis (available for Tier 1 users)
and select the 500 kits option. Once finished, save the ZIP
file to your local drive and unzip it. Select all HTML files
in the |
| WikiTree compact tree HTML (saved page) |
How to save a WikiTree compact treeOn WikiTree, open the profile of the person you want as the tree root. Click the compact tree (pedigree) icon next to their name to open the Compact Tree page. In your browser, save that page as an HTML file (File → Save Page As). Then select the saved file here to import all available ancestors. |
Phase 6: Link your own tree
- In your profile pane click Link to Existing Tree.
- Select the tree, pick yourself as the root person, save. Your tree now participates in the common-ancestor search.
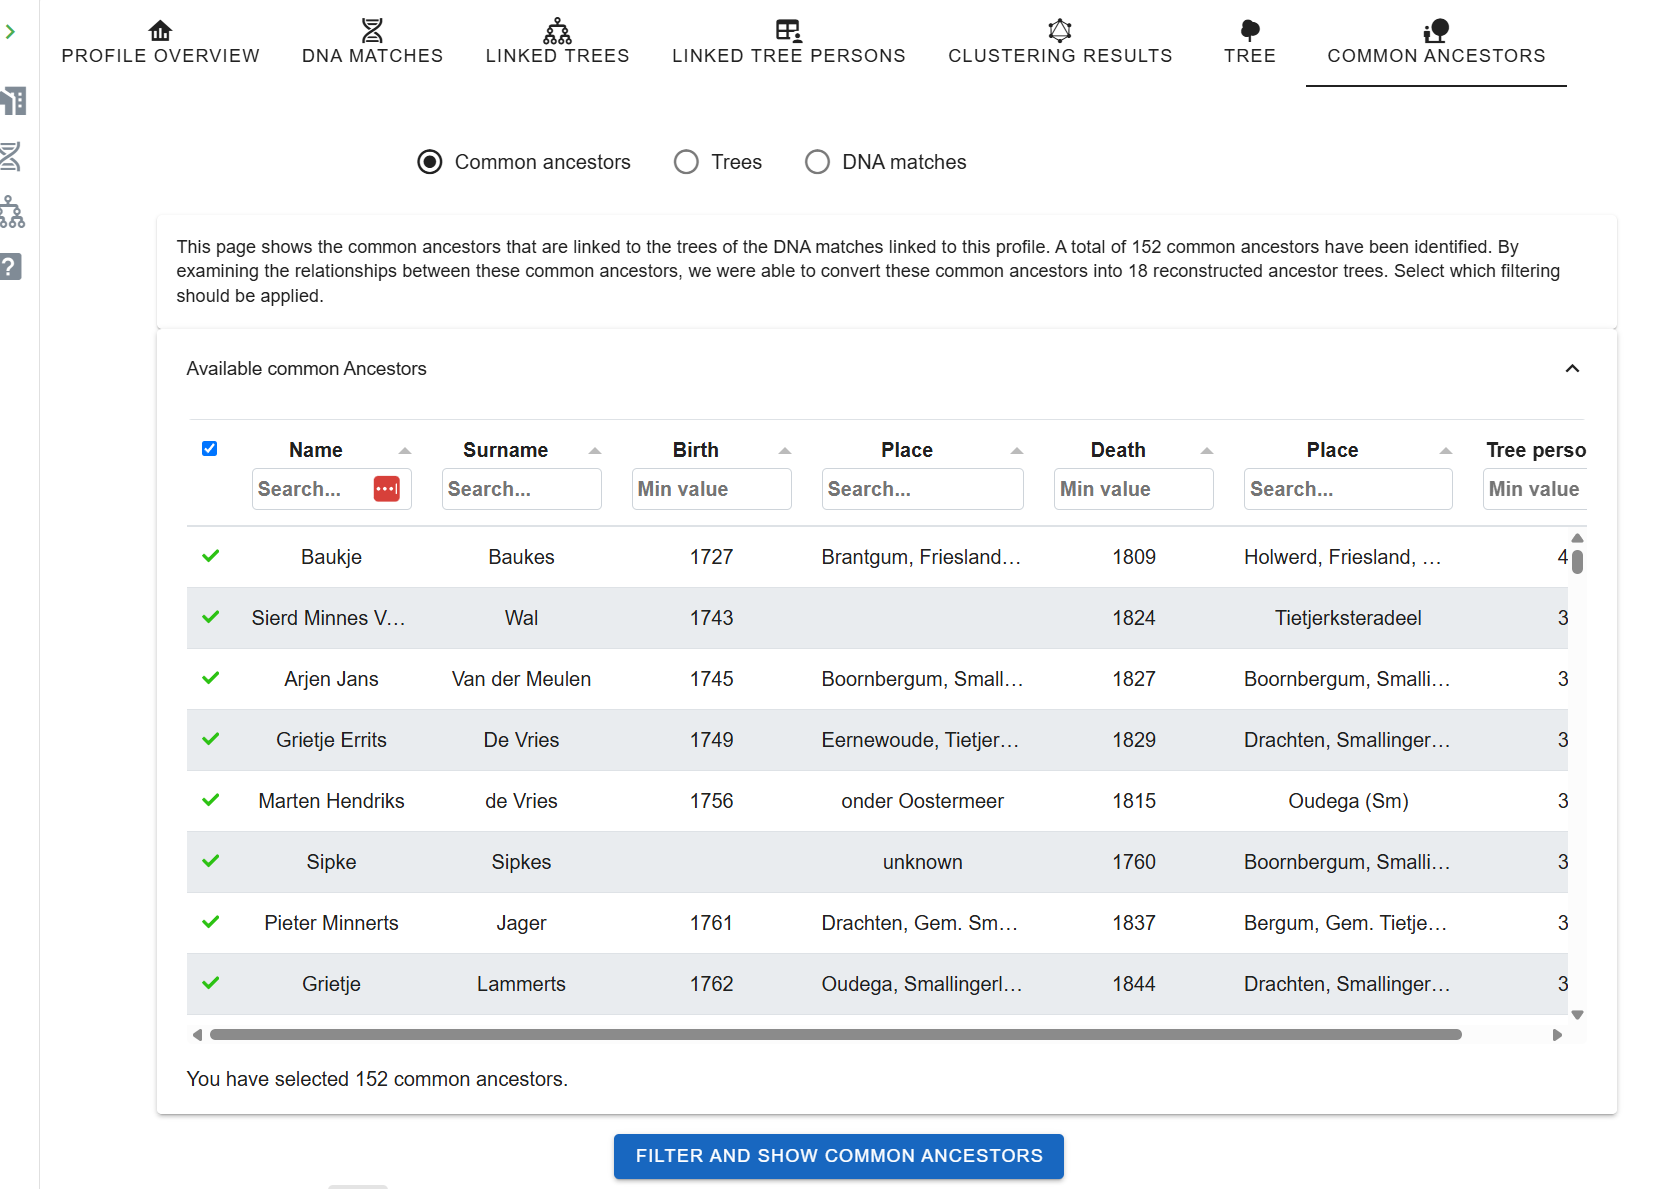
Phase 7: Find common ancestors
- Open Find Common Ancestors from the Profile perspective. Adjust name-matching strictness, birth/death year tolerance (default ±2 years), and comparison parameters.
- Run. A dialog reports how many trees and MRCAs were found.
- Filter reconstructed trees by common ancestor, tree, or linked DNA match.
If expected matches don't converge on an MRCA, it's usually due to small tree inconsistencies, a missing middle name, a birth year off by three, a maiden-vs-married surname. Fix one tree and re-run.
Phase 8: Refined AutoKinship inside AutoLineage
The standalone AutoKinship tool works from shared-cM numbers alone. Running AutoKinship inside AutoLineage is more powerful because you can tell it what you already know: mark a match as a known first cousin, flag two matches as siblings, or set generational offsets. You can also feed in MRCA information gathered in Phase 7, so the probability engine treats documented ancestors as fixed points and only considers trees consistent with both the DNA and the genealogy. The result is a tighter, better-anchored tree than the standalone tool can produce.
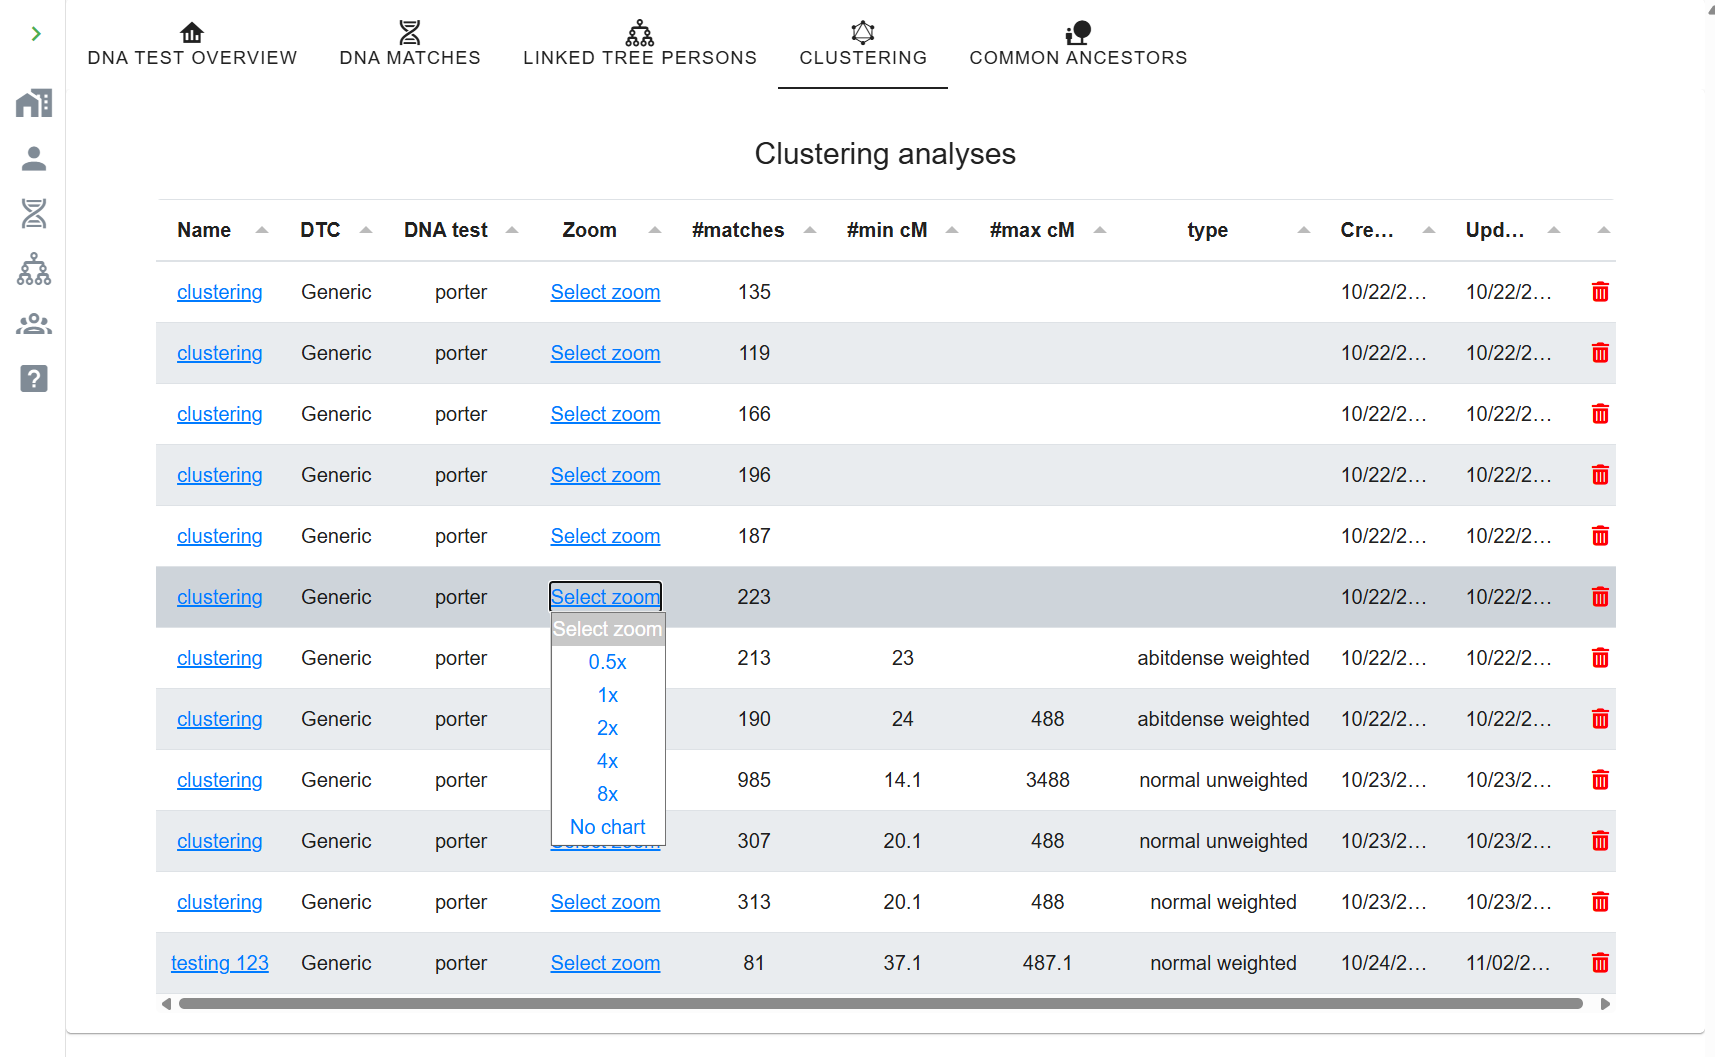
- In the clustering view, select 1× view and open the cluster for which you want to reconstruct a tree from DNA evidence and MRCA data (where available).
- Click the matches pane at the top of the cluster, an AutoKinship button appears.
- The wizard lets you set max generations, trees per iteration, final trees to keep, plus Include known relationships and Include MRCA relationships.
- Before running, define known relationships manually, yourself to any match, any match to any other, generational offsets.
- Run. The output is a blended tree: DNA evidence fills the blanks for matches without trees, and documented genealogy provides structure where it exists.
Weighted vs. unweighted clustering
Unweighted clustering (the traditional default) treats every shared-match relationship equally. Weighted clustering considers the cM amount between shared matches, heavy-cM connections pull matches together more strongly. Weighted clustering often resolves generational depth: one weighted cluster may point to 2×-great-grandparents while a sibling cluster points to 3×-great-grandparents. Try both and compare.
Starting with specific matches of interest inside AutoLineage
As in AutoCluster, you can choose start with specific matches of interest inside AutoLineage to focus an analysis on the shared matches of a single high-cM cousin and see all the branches you share, especially powerful combined with weighted clustering.
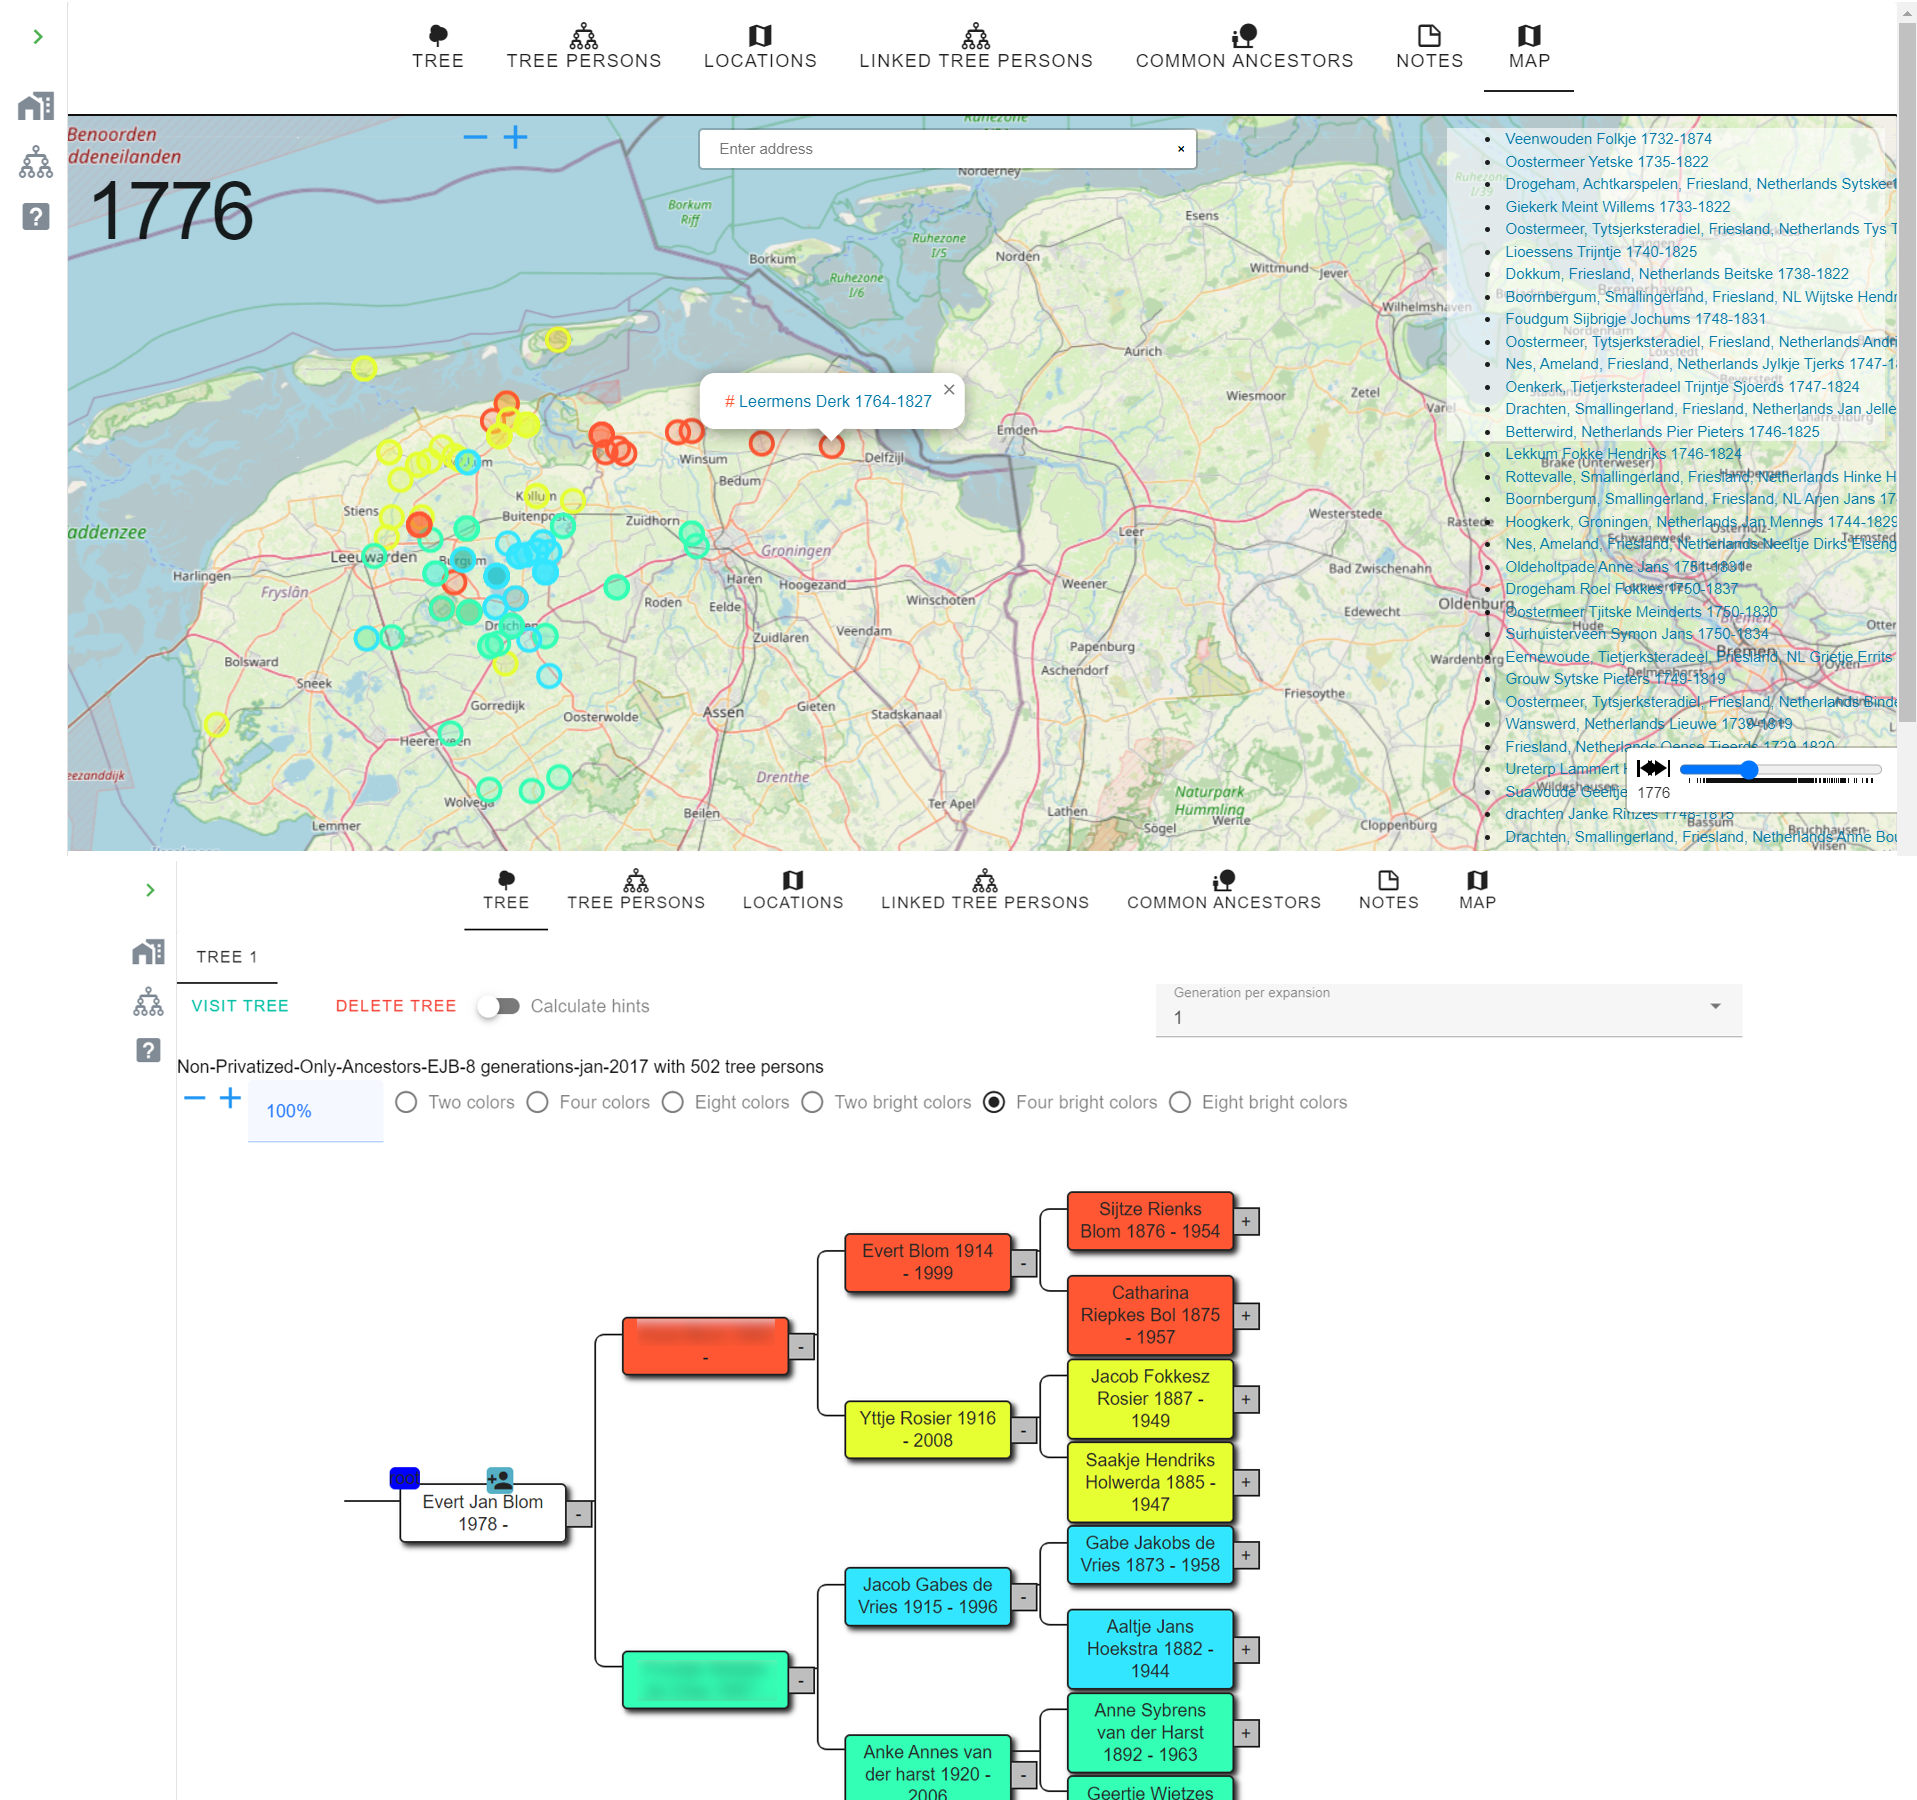
Location analysis
AutoLineage can plot every birth, marriage and death location from a tree (or from all trees linked to a cluster) on an interactive map with an event-time slider. Useful for spotting regional clustering, migration patterns, and for comparing several trees simultaneously. Colour schemes of 2, 4 or 8 ancestral branches make geographic inheritance visible at a glance.
Tips
- Back up often, click Backup at the bottom of the DNA Test Overview to save a JSON snapshot.
- Name GEDCOMs with the match's name and shared cM for fast auto-linking.
- Import your own tree and mark yourself as root first.
- Try weighted clustering before giving up on a messy cluster.
- Iterate: cluster → gather trees → common ancestors → AutoKinship → revise manual relationships → repeat. Each pass improves the reconstructed trees.
Other tools
Alongside the main automated analyses, Genetic Affairs provides several supporting tools for situations where automated retrieval is not available or where you want to work with data you already have.
CSV file-based clustering
Any DNA testing company can be clustered manually as long as you can export two CSV files: a match list and a shared-match list. This makes the tool useful for companies that do not support automated retrieval, such as LivingDNA, or for older exports you already have saved.
Input files
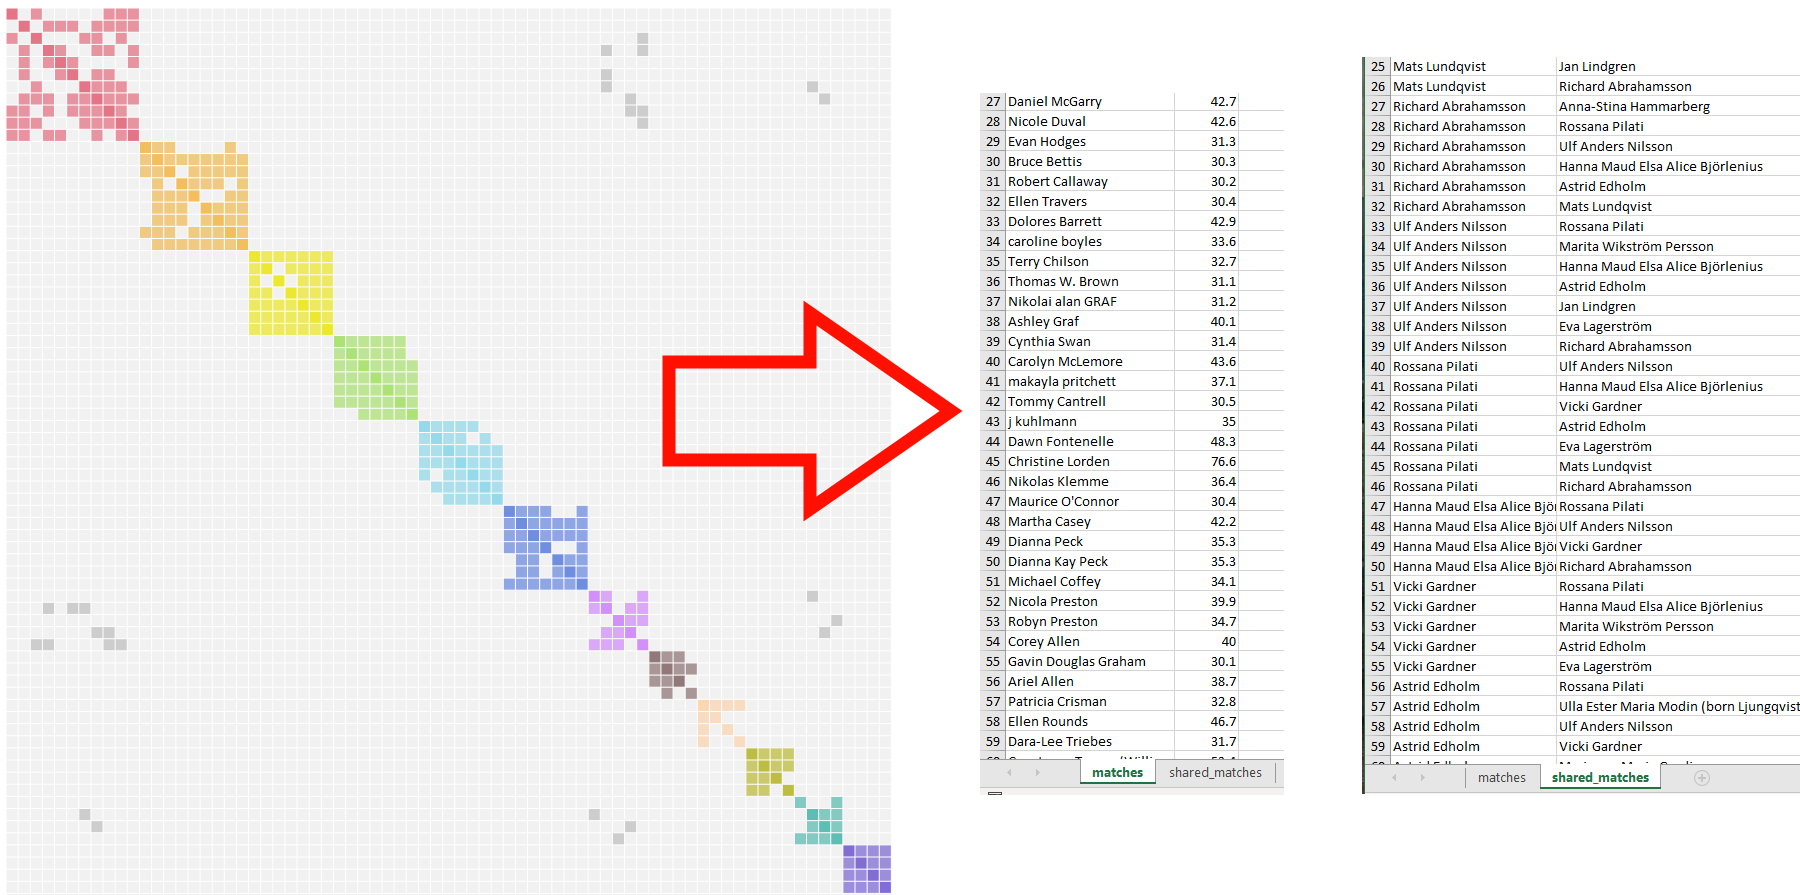
| File | Required columns |
|---|---|
| Match list | Column A: match name · Column B: cM value (optional) · Column C: notes (optional) |
| Shared-match list (filename must contain "shared") | Column A: primary match name · Column B: shared match name |
How to run
- Export or manually compile the two CSV files from your testing company.
- On the members landing page, click Run AutoCluster and choose CSV upload.
- Upload both files and submit.
- Results arrive by email as a ZIP containing an HTML cluster chart and an Excel spreadsheet.
Recluster a MyHeritage chart
MyHeritage's embedded AutoCluster sorts clusters by size, placing the largest cluster first. Reclustering reorders and regroups those clusters using the Genetic Affairs algorithm, which can reveal finer structure and bring related clusters together that the size-sorted view kept apart.
- In your MyHeritage account, open the AutoCluster chart and save the page as an HTML file.
- On the members landing page, click Recluster MyHeritage AutoClusters.
- Upload the saved HTML file.
- The reclustered chart is returned as a ZIP with an HTML chart and Excel file.
Transform AutoCluster HTML to Excel
Older AutoCluster analyses were delivered as HTML files only. This tool converts any existing AutoCluster HTML report into an Excel spreadsheet, making the data easier to sort, filter and annotate, without having to re-run the analysis.
- On the members landing page, click Transform to Excel.
- Upload your existing AutoCluster HTML file.
- Download the resulting Excel file.
Glossary
AutoCluster: Tool that groups DNA matches into shared-match clusters.
AutoKinship: Tool that predicts family trees from shared DNA alone.
AutoLineage: Flagship tool. Cross-company workbench for clustering, tree import, common-ancestor detection and tree reconstruction.
AutoSegment: Tool that clusters matches by overlapping DNA segments.
AutoTree: Tool that searches match trees for common ancestors and reconstructs partial trees.
Bucketing / Family Matching: FTDNA's system for labelling matches as paternal or maternal. Once enabled, Genetic Affairs displays P/M labels in cluster visualizations.
cM (centimorgan): Unit of genetic distance measuring shared DNA segment length. Most thresholds in Genetic Affairs are expressed in cM.
Cluster: A group of DNA matches who share DNA with each other as well as with you, suggesting a shared ancestral line.
Common ancestor / MRCA: The most recent ancestor shared by two or more descendants.
Endogamy: Historical pattern where people in a closed population mostly married within it. Inflates shared-cM values and shared-match counts; requires special handling.
GEDCOM: Industry-standard file format for exporting and importing family trees.
Gephi folder: Folder inside Genetic Affairs reports
with nodes.csv (matches) and
edges.csv (shared-match relationships). Re-importable
into AutoLineage.
ICW (In Common With): Two matches who both match you and each other.
Pile-up region: Chromosome region where many unrelated people share segments for population-level reasons. AutoSegment can filter these.
Triangulation: Three or more people sharing the same segment at the same chromosomal location, strongly implying a common ancestor. Only GEDmatch publishes triangulation data directly.
Triangulated Group (TG): Set of testers who triangulate on the same segment.
Weighted vs. unweighted clustering: In AutoLineage, weighted clustering factors in the cM between shared matches; unweighted treats every relationship equally.
Where to get help
Support channels
-
Contact form:
members.geneticaffairs.com/contactus
(secret-question answer:
affairs). - Email: info@geneticaffairs.com
- Facebook user group: Genetic Affairs, User Group. Active community of users; Evert-Jan posts announcements here.
- Newsletter archive: on your members landing page.
Further reading: blog walkthroughs and tutorials
Two independent bloggers have been documenting Genetic Affairs tools with real-world examples and step-by-step screenshots for years. Their articles are an excellent companion to this manual, especially when you want to see how a particular workflow looks end-to-end on a real match list. Posts are tagged by author below: writes at DNAeXplained; writes at Patricia Coleman Genealogy. Both are trusted voices in the genetic-genealogy community and both work extensively with Genetic Affairs in their own research.
Articles are listed in chronological order within each tool so you can see how features have evolved. For a current, end-to-end walkthrough, start with Roberta Estes' February 2026 AutoKinship article: it covers the complete modern workflow from registering an FTDNA kit through to refined tree reconstruction in AutoLineage.
AutoCluster
- AutoClustering by Genetic Affairs The foundational introduction to AutoClustering: what clusters are, how they form, and why they are useful for genealogy. A good starting point if you are new to clustering.
- Manual AutoClusters for LivingDNA Example of using the CSV-upload version of AutoCluster on a match list from a site that is not directly supported, here, LivingDNA, after a Leeds-method analysis.
- Genetic Affairs AutoFastClusters Introduction to the in-browser instant-clustering spreadsheet, paste match data and get a cluster chart without waiting for an email report.
- Utilizing MyHeritage AutoClusters to Analyze your DNA Matches Step-by-step guide to AutoClusters as embedded at MyHeritage, paired with Theories of Family Relativity, triangulation, Smart Matches and shared ancestral surnames.
- Comparison of ICW AutoCluster and AutoSegment AutoCluster Side-by-side comparison of shared-match (ICW) clustering versus segment-based clustering, valuable for deciding which tool to reach for on a given problem.
- Convert old AutoCluster reports to Excel Repurposing older HTML cluster reports into spreadsheet form so you can re-run analyses without regenerating the report.
- Improved AutoCluster clustering on GEDmatch Walkthrough of the enhanced AutoClustering available as part of GEDmatch Tier 1, including automatic AutoTree generation from match GEDCOMs.
- Exploring AutoClusters Practical exploration of what an ICW cluster actually tells you and how to interpret the grey cells, cluster colours and shared-match patterns.
AutoTree
- Genetic Affairs Reconstructs Trees from Genetic Clusters, Even Without Your Tree or Common Ancestors The foundational article on automated tree reconstruction from your matches' trees. Especially valuable for adoptees and testers without their own tree.
- AutoPedigree Combines AutoTree with WATO to Identify Your Potential Tree Locations How AutoPedigree layers statistical hypothesis-placement on top of AutoTree output to rank candidate positions for the tester, a powerful combination for unknown-parent searches.
AutoSegment
- AutoSegment Cluster The introductory article on segment-based clustering and how it differs from ICW clustering, essential background before running your first AutoSegment.
- GEDmatch AutoSegment Using the GEDmatch Tier 1 AutoSegment with both triangulated-segment data and all-segment data. Still the most accurate segment-cluster workflow available.
- Genetic Affairs Hybrid AutoSegment Cluster Combining segment data from 23andMe, FTDNA, MyHeritage and GEDmatch into a single cross-company cluster analysis. Most useful for users who already hold segment files from multiple companies.
- AutoSegment Triangulation Cluster Tool at GEDmatch Detailed walkthrough of the triangulation-verified GEDmatch AutoSegment: pile-up filtering, Excel output, DNAPainter import and linked-cluster membership.
- AutoSegment ICW Enhancement, Find Segments Linked to Opposite Parent Sides Using AutoSegment's ICW enhancements to infer that matches on overlapping segments who do not share each other are likely on opposite parental sides.
AutoKinship
- New AutoKinship Tool Predicts Relationships and Builds Genetic Trees The launch walkthrough for the original 23andMe AutoKinship, covering surname enrichment, the relationship matrix, triangulation and overlapping segments.
- Reconstruct trees for MyHeritage matches using AutoKinship The MyHeritage-flavoured AutoKinship workflow, tree prediction from DNA alone, without requiring any tree from you or your matches.
- AutoKinship at GEDmatch by Genetic Affairs The "super-sundae" GEDmatch report that integrates AutoCluster, AutoSegment, AutoTree and AutoKinship, with automatic triangulation via GEDmatch's three-way matching.
- AutoKinship at GEDmatch A practical case-study of the GEDmatch AutoKinship tool applied to real matches, with notes on interpreting the generated trees.
- AutoKinship by Genetic Affairs Builds Family Trees from Your Matches at FamilyTreeDNA, and More The definitive end-to-end walkthrough of the modern FTDNA AutoKinship workflow, from registering an FTDNA profile, through automated clustering and kinship, to refining the result in AutoLineage with common-ancestor integration. Start here if you want one article that covers the whole pipeline.
AutoLineage
- AutoLineage The launch introduction to AutoLineage: cross-company clustering, MRCA discovery across multiple testing sites, tree imports and the unified profile concept.
- Linking GEDmatch and FTDNA, AutoLineage for iGG How to bring FTDNA and GEDmatch data together under a single AutoLineage profile, a common scenario for investigative genetic-genealogy cases where only these two sources are available.
- Pruning Your Trees in AutoLineage Keeping reconstructed trees tidy when a DNA match has multiple trees attached, a practical cleanup guide for Find Common Ancestors results.
- Convert Ancestry ProTools to Trees using AutoLineage and AutoKinship Running AutoKinship on individual Ancestry ProTools clusters inside AutoLineage, free of additional credit cost, and a big boost for Ancestry-only research.
- A Shortcut for Saving Pro Tools Shared Matches Speeding up the collection of Ancestry Pro Tools shared-match data for AutoLineage import, practical time-saving tips.
- More Shortcuts for AutoLineage Efficiency tips when research is focused on one specific family line, a case study using the Collins line from Ireland.
- Exhaustive MRCA Analysis for GEDmatch Matches Using the GEDmatch Tier 1 import in AutoLineage to run MRCA analysis against up to 7,500 matches, the largest-scale common-ancestor search available.
- AutoKinship for MyHeritage and Ancestry: From Matches to Reconstructed Trees Running AutoKinship on any cluster inside AutoLineage, now available for MyHeritage and Ancestry data, not just FTDNA.
- New Copy and Paste Option in AutoLineage Introduction to the Copy-Paste Wizard, import Ancestry matches and shared matches without saving any HTML. The current recommended workflow for Ancestry data.
- A Quick Note: AutoLineage Trees Short tip on avoiding duplicate tree entries when a tree has already been auto-imported for a match.
Overview & index articles
- Genetic Affairs Instructions and Resources Roberta's master index of her Genetic Affairs articles, organised by tool. A useful jumping-off point for the whole blog-post collection.
- DNAeXplained, Genetic Affairs category Every Genetic Affairs article Roberta has published, in reverse chronological order. Browse here for the very latest posts.
- Patricia Coleman Genealogy, Blog index Patricia's full blog archive. Many of her posts use real case studies to illustrate the tools in action, particularly AutoLineage.